Step 5: Link Luminex Data to Study |
2024-04-16 |
Premium Feature — Available upon request with all Premium Editions of LabKey Server. Learn more or contact LabKey.
Linking assay data into a study allows you to integrate it with other types of data from other sources. If you wish, you can skip this step and proceed to the next Luminex tutorial: Luminex Assay Tutorial Level II.In the steps below, we move selected, quality-controlled Luminex assay data into a LabKey study. In this example, we select only data associated with unknowns, and only data that have not been excluded as part of the QC process.In order to integrate assay data with other types of data in a LabKey study, you need to connect the instrument data to participants or specimen samples in some way. This step shows you how to link the sample identifiers in your instrument data with specimen vial identifiers in the target study. The links are provided in a mapping file that associates the sample identifiers (in the Description column, e.g., "111", "112", "113") with participant and visit identifiers in our target study. If you do not provide a mapping file, you would need to manually enter the participant identifier and visit for each row of data.
Install a Target Study
You need a target study for your assay data, so if you don't already have one, create one here:- To install the target study, complete the instructions in this topic: Install the Demo Study
ReImport a Run
Next we re-import a run, this time indicating a target study and a mapping file for the data.- Return to your Luminex folder.
- In the Assay List, click Luminex Assay 100.
- On the Luminex Assay 100 Runs list, place a checkmark next to 02-14A22-IgA-Biotin.xls (the original single run we imported).
- Click Re-Import Run.
- Under Batch Properties enter the following:
- Participant/Visit:
- Click the checkbox Sample indices, which map to values in a different data source.
- In the LuminexExample data you downloaded and unzipped, open the Excel file /Luminex/Runs - Assay 100/IndexMap.xls.
- Copy and paste the entire contents of this file (including all column headers and non-blank rows) to the text box under Paste a sample list as a TSV.
- Target Study:
- Select the target study you installed above.
- Click Next.
- On the page Data Import: Run Properties and Data File, scroll down and click Next.
- On the page Data Import: Analyte Properties you may see a warning about previous exclusions; leave the "Retain matched exclusions" checkbox checked if so.
- Scroll down and click Save and Finish.
Select a Subset of Data to Link
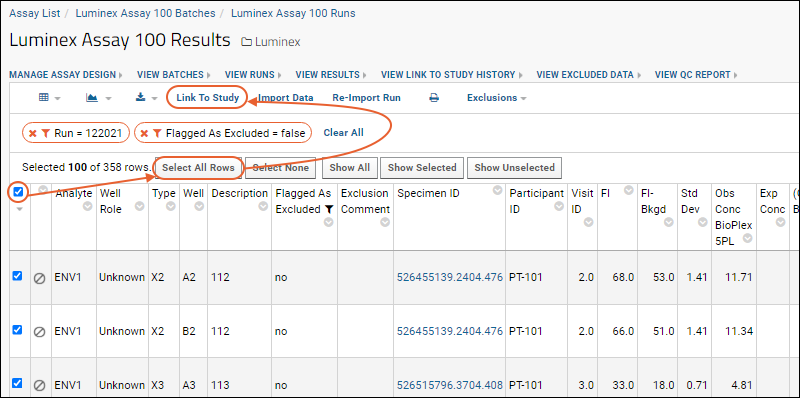
We want to exclude standards, controls and background wells in the data we link. We also plan to exclude data that was flagged and excluded as part of the QC process.- On the page Luminex Assay 100 Runs click 02-14A22-IgA-Biotin.xls (reimporting made it the top row).
- Notice that your data grid now includes values in the Specimen ID, Participant ID, and visitID columns which were not present during the earlier tutorial steps. We populated them by pasting the IndexMap values during the reimport.
- Filter the results to show only values we were able to map to study participants.
- Click the Participant ID column header and select Filter.
- In the popup, click Choose Filters, then the filter type Is Not Blank, then click OK.
- Filter the results to show only wells with non-excluded data:
- Click the Flagged As Excluded column header and select Filter.
- In the popup, select only false and click OK.
- If it is not already filtered by your saved grid view, filter the results to show only wells with unknowns (vs standards or controls):
- Click the Well Role column header and select Filter.
- If "Unknown" is the only option, you don't need to take any action. If not, select Unknown by clicking its label, and click OK.
- Select all displayed rows on the current page of the grid using the checkbox at the top of the left column.
- You will see a message reading "Selected 100 of ### rows" alongside other select/show options. Notes: the total number of rows may vary based on the exclusions and filters you set. Also, '100' is the default grid paging option but other settings are available.
- Click Select All Rows.

Link Selected Data to the Study
- Click Link to Study.
- Note that we have pre-selected our target study and you will confirm that it is the target. If you wanted, you could choose a different target study, and/or specify a dataset Category for the linked data.
- Click Next.
- The data in this case will be successfully matched to participants/visits in our example study. You will see (checkmarks) next to each row of data that has been successfully matched, as shown in the screen shot below.
- Finalize by clicking Link To Study.
View the Linked Data in the Study
- To see the dataset in the study, click the Clinical and Assay Data tab.
- Find your linked Luminex dataset on the list, and click to view the data.