Step 1: Export Chart as JavaScript |
2024-04-20 |
This tutorial starts by making a time chart grouped by treatment group, then exporting the JavaScript to use in the next tutorial steps. This example uses the sample study datasets imported as part of our tutorial example study.


Create a Timechart
- Navigate to the home page of your sample study, "HIV Study." If you don't have one already, see Install the Sample Study.
- Click the Clinical and Assay Data tab.
- Open the LabResults data set.
- Select (Charts) > Create Chart.
- Click Time.
- For the X Axis select Visit-Based.
- Drag CD4 from the column list to the Y Axis box.
- Click Apply.
- You will see a basic time chart. Before exporting the chart to Javascript, we can customize it within the wizard.
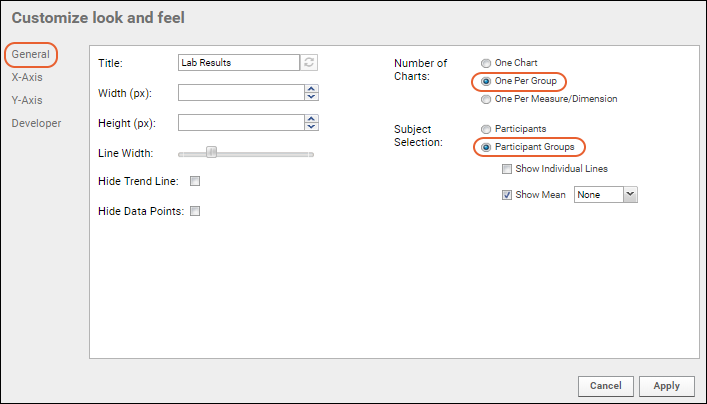
- Click Chart Layout, then change the Subject Selection to "Participant Groups". Leave the default "Show Mean" checkbox checked.
- Change the Number of Charts to "One per Group".
- Click Apply.
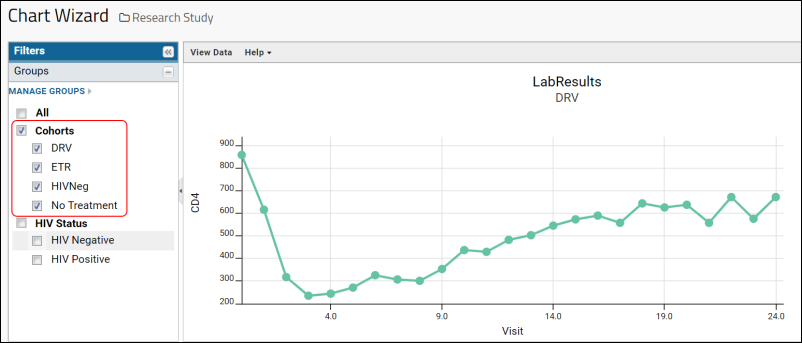
- In the Filters > Groups panel on the left, select Cohorts and deselect anything that was checked by default. The chart will now be displayed as a series of four individual charts in a scrollable window, one for each treatment group:

Export to JavaScript
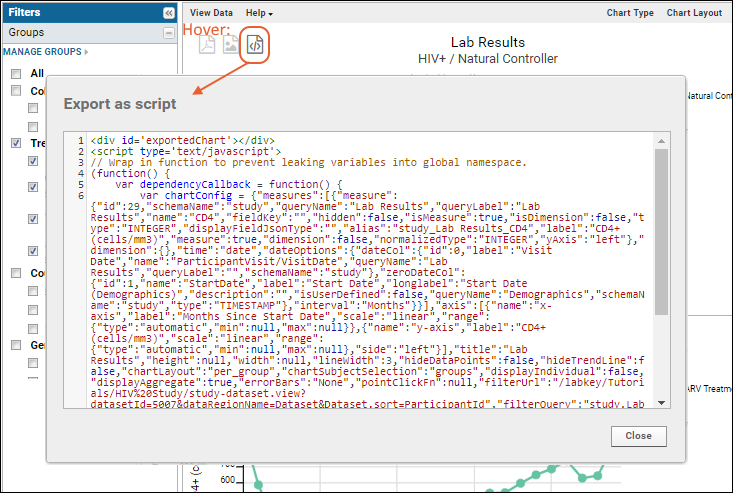
- Hover over the chart to reveal the Export buttons, and click to Export as Script.
- You will see a popup window containing the HTML for the chart, including the JavaScript code.

- Select All within the popup window and Copy the contents to your browser clipboard.
- Click Close in the popup. Then Save your chart with the name of your choice.
- Before proceeding, paste the copied chart script to a text file on your local machine for safekeeping. In this tutorial, we use the name "ChartJS.txt".