This topic helps you find the information you need in TZM-bl Neutralization (NAb) data imported into LabKey.
NAb Assay Properties
Default NAB assay designs include properties beyond the default properties included in
Standard assay designs. For any TZM-bl Neutralization (NAb) assays, the following additional properties can be set.
Assay Properties
- Plate Template: The template that describes the way your plate reader outputs data. You can:
- Choose an existing template from the drop-down list.
- Edit an existing template or create a new one via the Configure Templates button.
- Metadata Input Format: Assays that support more than one method of adding sample/virus metadata during the data import process can be configured by selecting among possible options. Not all options are available for all configurations:
- Manual: Metadata is entered manually at the time of data import. Available for low-throughput NAb assays only.
- File Upload (metadata only): Metadata is uploaded in a separate file from the actual run data at the time of data import.
- Combined File Upload (metadata & run data): Upload a combined file containing both metadata and run data. Available only for some high-throughput NAb assays.
For information about file formats used, see
NAb Plate File Formats.
Run Properties
- Cutoff Percentages 1 (required), 2, and 3
- Host Cell
- Study Name
- Experiment Performer
- Experiment ID
- Incubation Time
- PlateNumber
- Experiment Date
- FileID
- Lock Graph Y-Axis (True/False): Fixes the Y axis from -20% to 120%, useful for generating graphs that can easily be compared side-by-side. If not set, axes are set to fit the data, so may vary between graphs.
- Curve Fit Method. Required. The assay's run report (accessed through the details link) generates all graph, IC50, IC80 and AUC information using the selected curve fit method. You can choose from the following types of curve fits:
- Five parameter (5-pl): A generalized version of the Hill equation is used.
- Four parameter (4-pl): A generalized version of the Hill equation is used.
- Polynomial: This algorithm allows you to quantifying a sample’s neutralization behavior based on the area under a calculated neutralization curve, commonly abbreviated as “AUC”.
Sample Fields
For each run, the user will be prompted to enter a set of properties for each of the sample well groups in their chosen plate template. In addition to Standard assay data property fields, which include date and participant/visit resolver information, NAb assays include:
- Sample Description. Optional.
- Initial Dilution. Required. Sample value: 20.0. Used for calculation.
- Dilution Factor. Required. Sample value: 3.0. Used for calculation.
- Method. Required. Dilution or Concentration.
For more information and a tutorial on designing and using NAb Assay Tools, see
Tutorial: NAb Assay.
View Additional Data
The default views of run and result data do not display all the available information. You can also find the following information:
Per-sample Dilution Data
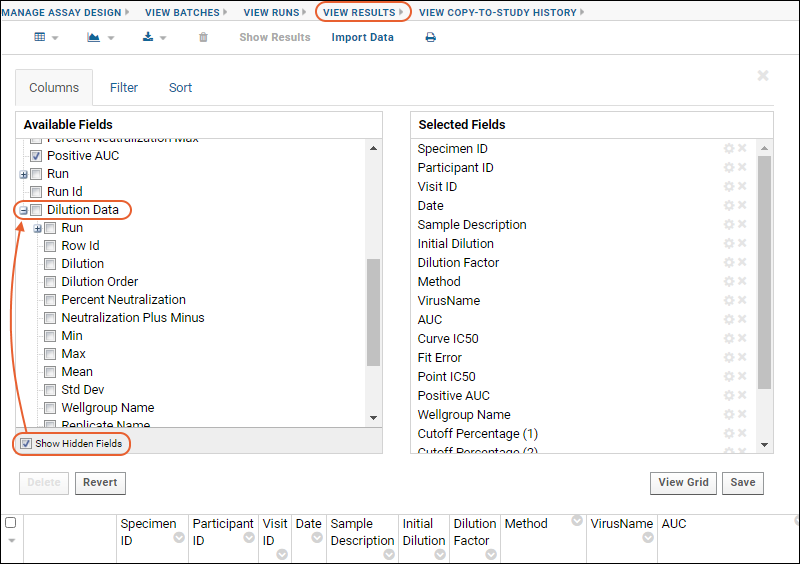
The NAb assay results grid has a hidden lookup FK column to allow for the existing per-sample dilution data to be pulled into the results grid view.
- Select (Admin) > Manage Assays.
- Click your assay name to open the runs page.
- Click View Results.
- Select (Grid View) > Customize Grid.
- Check the box to Show hidden fields (at the bottom of the available fields panel).
- Scroll to find the Dilution Data node and click to expand it.
- Check boxes for the data you want to show in your results grid.

Per-run Cell and Virus Control Aggregate Data
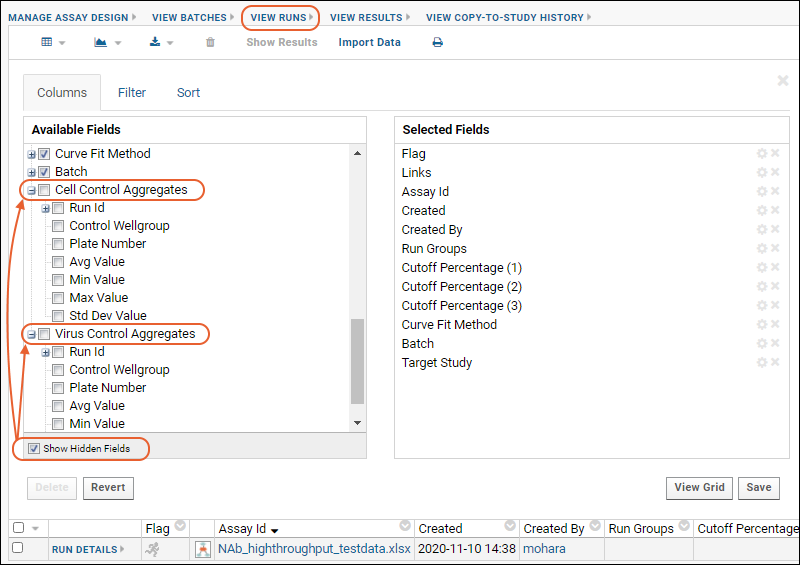
New aggregate queries were added to the NAb assay schema to view per-run cell and virus control aggregate data. For each run, you can see the following for each control:
- Avg Value
- Min Value
- Max Value
- Std Dev Value
- Select (Admin) > Go To Module > Query.
- Open the assay schema, then the folder for your NAb Assay type (such as "Single Plate Dilution NAb" and) and assay design.
- Under built-in queries & tables click the name of the table you want to view.
- CellControlAggregates
- VirusControlAggregates
- Click View Data to see the data.
To pull these values into the Runs grid view:
- Select (Admin) > Manage Assays.
- Click your assay name to open the runs page.
- Select (Grid View) > Customize Grid.
- Check the box to Show hidden fields (at the bottom of the available fields panel).
- Scroll to find the Cell Control Aggregates and/or Virus Control Aggregates nodes.
- Expand the node and check boxes for the data you want to show in your results grid.

Show Curve Fit Parameters
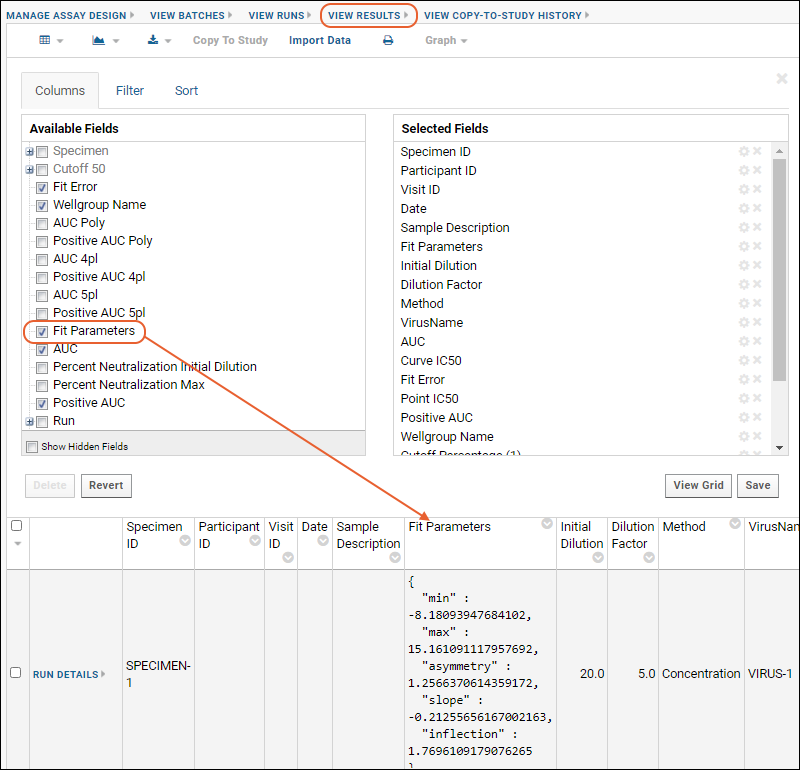
A new "Fit Parameters" field was added to the Nab assay results grid to store the curve fit parameters based on the selected curve fit method for a given run. This new field was populated via an upgrade script for all existing NAb runs.
- Select (Admin) > Manage Assays.
- Click your assay name to open the runs page.
- Click View Results.
- Select (Grid View) > Customize Grid.
- Check the box for Fit Parameters and click View Grid to see them in the grid (you can drag them to anywhere in the column list you like).

- The Fit Parameters are shown as a set of key value pairs helping you identify the curve fit method used.
Related Topics