To support the development of robust and reproducible assays, Panorama offers reporting that summarizing analysis of replicates of the same sample multiple times a day over multiple days to assess inter- and intra-day variability. 3 replicates over 3 days or 5 replicates over 5 days are common usages. As long as at least 3 runs are included, Panorama will generate the Reproducibility report for that protein. The report relies on a Replicate annotation in Skyline to identify the day for grouping purposes. The
Reproducibility Report visualizes the reproducibility of the assay and which peptides perform best.
The current implementation of the report is specific to protein/peptide data and does not yet support small molecule data.
Configure Skyline Document
For this report, you will load a Skyline document containing multiple replicates for a protein. You must include a Day replicate annotation, and you may want to also captures both NormalizedArea and CalibratedArea values, in order to take advantage of the options available below.
To configure, start in Skyline:
- Select Settings > Document Settings
- On the Annotations tab, click Add...
- Use "Day" as the name, and leave the Editable button toggled
- Check Replicates from the "Applies to" list
- View->Document Grid and choose "Replicates" from the Reports drop-down
- Fill in values for the Day column for the replicates that you want to include in the reporting. You can use whatever values you like to identify the timepoint - "Day 1", "Day 2", "10-08-2021", "Batch 1", etc.
Optionally, add annotations to capture the normalized and calibrated areas.
- Select Settings > Document Settings
- On the Annotations tab, click Add...
- Use "NormalizedArea" or "CalibratedArea" as the name, and choose the Calculated button
- Check Precursor Results from the Applies to list
- Choose the value to plug in for the annotation. Precursor->Precursor Results->Precursor Quantitation->Precursor Normalized Area or ->Calculated Concentration. Use "Sum" as the aggregate
Create Folder and Load Document
To use this report, start in a
Panorama folder of type "Chromatogram library".
When you import a Skyline document containing protein data, the system will automatically add a new
Proteins tab.
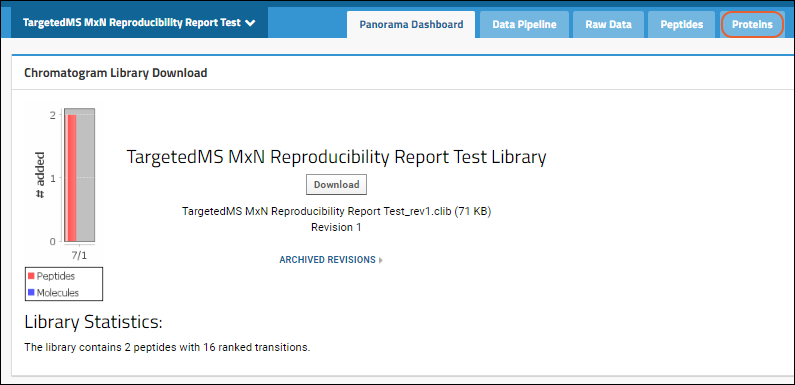
The protein list on this tab contains Protein/Label, Accession, Preferred Name, Gene, Description, Species, File Name, Protein Note/Annotations and Library State (if available). For proteins where there are multiple replicates included in the document, you will see a
link next to the protein / label. Click it to open the Reproducibility Report.

View Reproducibility Report
The report will look for a Replicate annotation named "Day" in the Skyline document to analyze for intra- and inter-day variability. In the absence of this annotation, the report will not be available.
The report contains a series of panels:
- Protein: This overview section shows some basic metadata about the protein and the file it was loaded from.
- Sequence Coverage (if available): View the peptide coverage within the protein sequence. Select among viewing options.
- Annotations (if available)
- Precursors: The precursor listing can be filtered and sorted to customize the report.
- If the Skyline document includes paired heavy and light precursors, you will be able to select either Intensity or Light/Heavy Ratio values for the report. Learn more below.
- Any CV values (inter-day, intra-day, or total) over 20 in this section are highlighted in red.
- You can click the link in the second column header to Copy the filtered peptide list to the clipboard.
- Depending on the selection in the Precursors panel, the first plot is one of these:
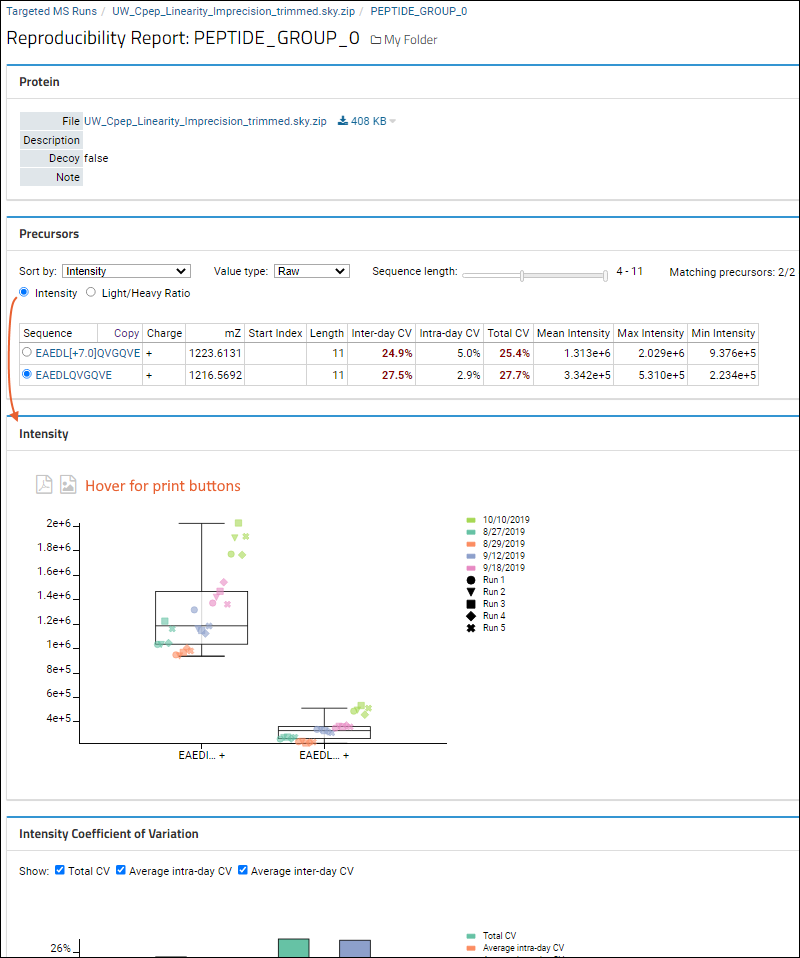
- Hover anywhere on the plots for buttons to print to PDF or PNG.
- Coefficient of Variation for either intensity or light/heavy ratio.
- Chromatograms: Clicking on a precursor in the plots or summary table will select that precursor and scroll to its chromatograms at the bottom of the page.
- Calibration Curve/Figures of Merit: If the imported Skyline file contains calibration data, we will show the Calibration curve on the page. Figures of Merit (FOM) will be displayed below the calibration curve.
- The Figures of Merit section will only display the Summary table, with the title linking to the detailed FOM page
- The Calibration Curve title is also a link that would bring the user to a separate Calibration Curve page.
Annotations
If relevant annotations are available, they will be shown in the next panel. For example:

Precursor Listing Options
If the Skyline document includes paired heavy and light precursors, you will have two ways to view the reproducibility report, selectable using the radio button in the
Precursors web part. This selection will determine the plots you will see on the page.
- Intensity: Sort and compare intensity for peak areas and CV of peak areas data.
- Light/Heavy Ratio: Instead of peak area, analyze the ratio of light/heavy precursor peak area pairs (typically performed by isotope labeling).

- Sort by lets the user sort the precursors on the plots shown by:
- Intensity or Light/Heavy Ratio, depending on the radio button selection.
- Sequence
- Sequence Location (if two or more peptides are present)
- Coefficient of Variation
- Value type: When the document contains calibrated and/or normalized values, you can select among them. The default will depend on what's in the Skyline file: Calibrated, Normalized, and Raw in that order.
- Calibrated
- Normalized
- Raw
- Sequence Length: Drag the min/max endpoint sliders to filter by sequence length.
Click the link in the second column header to
Copy the filtered peptide list to the clipboard.
Intensity (Peak Areas)
When the
Intensity radio button is selected in the
Precursors web part, the data grid will show:
- Peptide sequence
- Charge
- mZ
- Start Index
- Length
- Inter-day CV (Note that if the report includes 1xN (a single day), the inter-day CV column will still be present, but values will be 0.0%.)
- Intra-day CV
- Total CV
- Mean Intensity
- Max Intensity
- Min Intensity
The
Intensity web part will plot the peak areas with the selected filters and sorts.
The plot will show each replicate's peak area, divided by run within the day, and day. A box plot will show the full range of all values. Data points will be arranged from left to right within each precursor based on their acquisition time.

Intensity Coefficient of Variation
Based on which
Show checkboxes are checked, this plot shows the averages for intra-day and inter-day peak areas, plus the "Total CV", which is the square root of the sum of the squares of the intra and inter-day CVs.
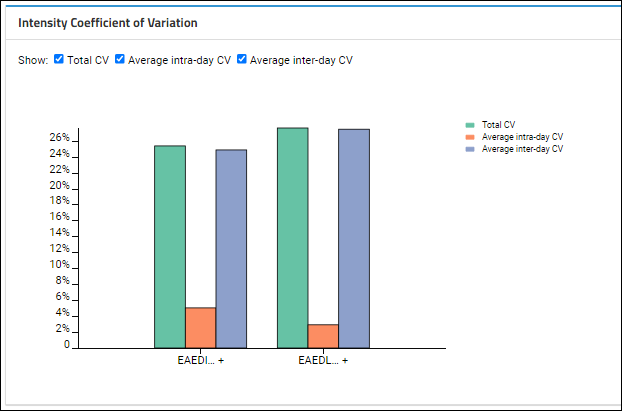
On the CV plot, hover over individual bars for a tooltip:
- For the inter- and intra-day CVs, see the full peptide sequence (with charge state and mz) and the standard deviation of the CVs, as well as the average CV (which is the value being plotted).
- For the total CV, you'll see the value and peptide sequence.
Light/Heavy Ratios
If the Skyline document includes paired heavy and light precursors, and
Light/Heavy Ratio is selected, the data grid will contain the following information:
- Peptide sequence
- Charge (light and heavy)
- mZ (light and heavy)
- Start Index
- Length
- Inter-day CV of light/heavy ratios of intensity (Inter-day CV)
- Intra-day CV of light/heavy ratios of intensity (Intra-day CV)
- Total CV of light/heavy ratios of intensity (Total CV)
- Mean value of light/heavy ratios (Mean Ratio)
- Max value of light/heavy ratios (Max Ratio)
- Min value of light/heavy ratios (Min Ratio)
The CV values will be highlighted in red if the number exceeds 20%. When a heavy ion is not present, the light/heavy ratio for that ion cannot be calculated. In this edge case, the Light/Heavy ratio for this ion will be displayed as "N/A" in the data grid. These ions will also not be shown in the Peak Areas Ratio and CV ratio plots.
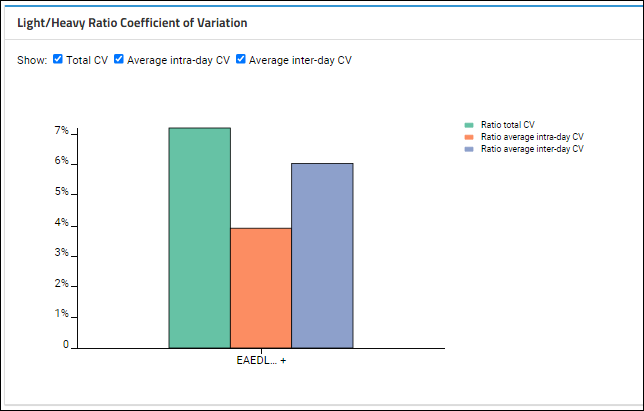
Light and heavy ions of the same type will be shown as one type of ion on the chart. For example: ratio data for EAEDL[+7.0]QVGQVE and EAEDLQVGQVE will be shown as EAEDL...+. If the light and heavy ions have different charges, then the ion will be shown on the graph without the charge information.
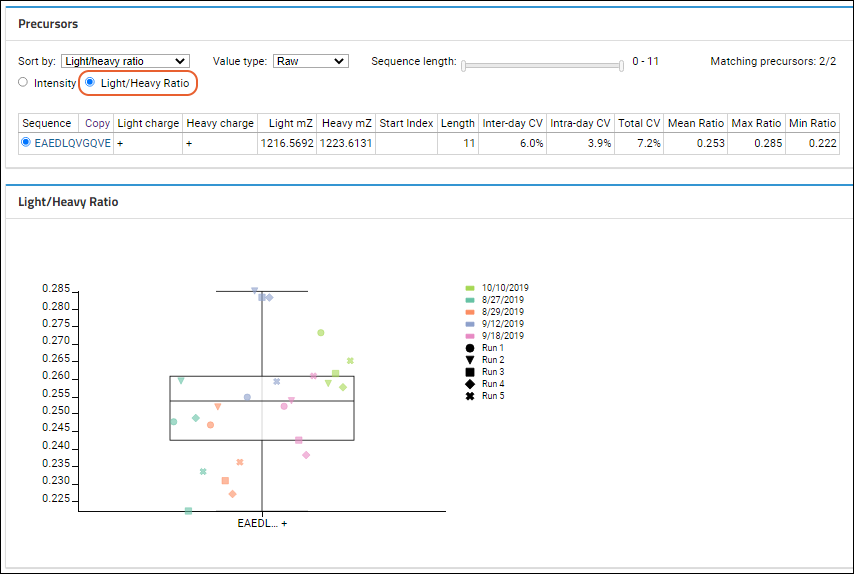
Light/Heavy Ratio Coefficient of Variation
Based on which
Show checkboxes are checked, this plot shows the averages for intra-day and inter-day peak areas, plus the "Total CV", which is the square root of the sum of the squares of the intra and inter-day CVs.
Chromatograms
One chromatogram per replicate is rendered, in a matrix-like layout, with rows that represent the days the data was acquired and columns that represent the indices within the day. Hence, the layout will reflect the MxN nature of the data.
When showing light/heavy ratios, the chromatograms at the bottom of the page will show both the light and heavy precursors plotted together for each replicate.
To see the full layout, expand your browser view. Individual plots are titled based on the day and index.
- Users can click to download a PDF or PNG of any chromatogram. Hover to see the buttons.
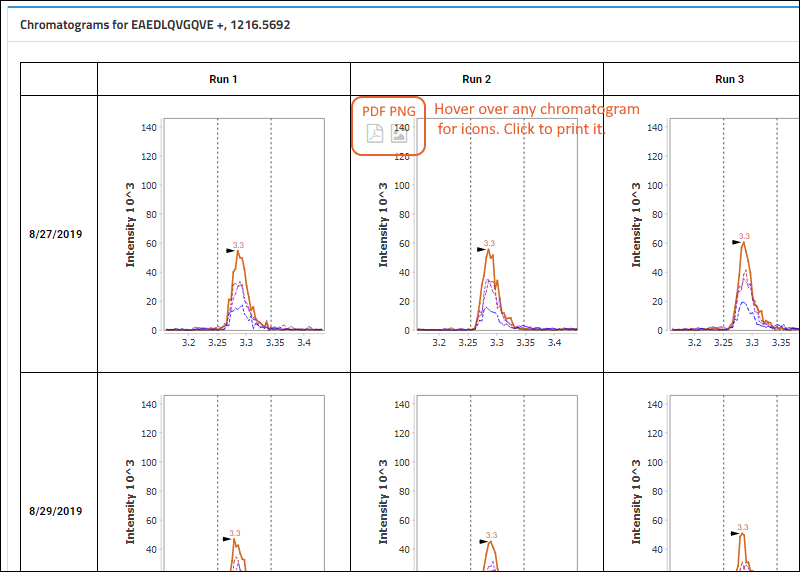
At the bottom of the panel of chromatograms, you can click
Show peptide details to switch to the
detail page with more adjustable ways to view chromatograms.
Related Topics