Flow Dashboard Overview
The main Flow dashboard displays the following
web parts by default:
- Flow Experiment Management: Links to perform actions like setting up an experiment and analyzing FCS files.
- Flow Summary: Common actions and configurations.
- Flow Analyses: Lists the flow analyses that have been performed in this folder.
- Flow Scripts: Lists analysis scripts. An analysis script stores the gating template definition, rules for calculating the compensation matrix, and the list of statistics and graphs to generate for an analysis.
Understanding Flow Column Names
In the flow workspace,
statistics column names are of the form "subset:stat". For example, "Lv/L:%P" is used for the "Live Lymphocytes" subset and the "percent of parent" statistic.
Graphs are listed with parentheses and are of the form "subset(x-axis:y-axis)". For example, "Singlets(FSC-A:SSC-A)" for the "Singlets" subset showing forward and side scatter.
Customize Your Grid View
The columns displayed by default for a dataset are not necessarily the ones you are most interested in, so you can customize which columns are included in the default grid. See
Customize Grid Views for general information about customizing grids.
In this first tutorial step, we'll show how you might remove one column, add another, and save this as the new default grid. This topic also explains the column naming used in this sample flow workspace.
- Begin on the main page of your Flow Tutorial folder.
- Click Analysis in the Flow Analyses web part.
- Click the Name: ADemoWorkspace.wsp.
- Select (Grid Views) > Customize Grid.
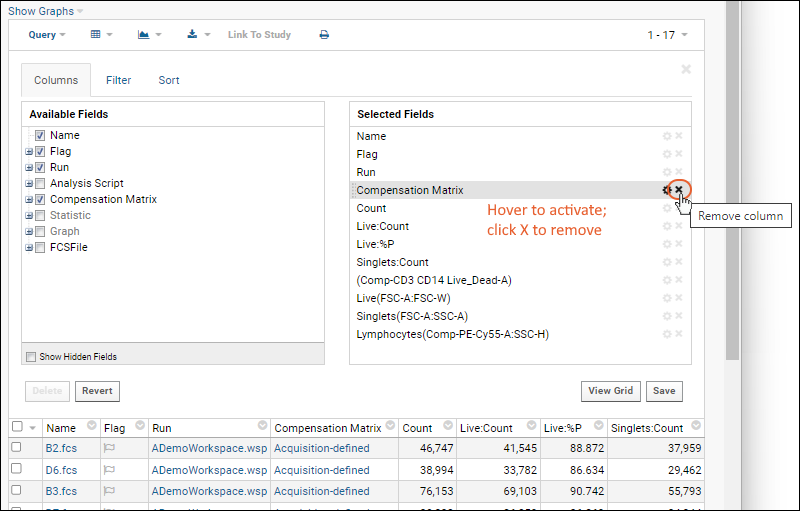
- This grid shows checkboxes for "Available Fields" (columns) in a panel on the left. The "Selected Fields" list on the right shows the checked fields.
- In the Selected Fields pane, hover over "Compensation Matrix". Notice that you see a tooltip with more information about the field and the (rename) and (remove) icons are activated.
- Click the to remove the field.

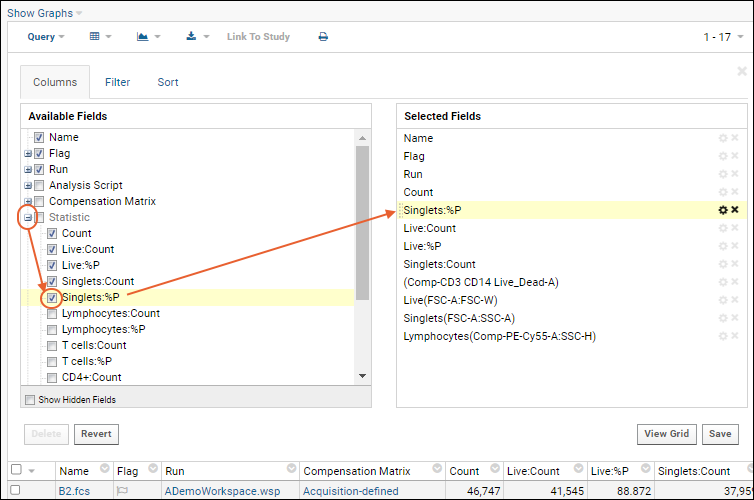
- In the Available Fields pane, open the Statistic node by clicking the icon (it will turn into a ) and place a checkmark next to Singlets:%P.

- By default, the new field will be listed after the field that was "active" before it was added - in this case "Count" which was immediately after the removed field. You can drag and drop the field elsewhere if desired.
- Before leaving the grid customizer, scroll down through the "Selected Fields" and notice some fields containing () parentheses. These are graph fields. You can also open the "Graph" node in the available fields panel and see they are checked.

- Click Save.
- Confirm that Default grid view for this page is selected, and click Save.
You will now see the "Compensation Matrix" column is gone, and the "Singlets:%P" column is shown in the grid.

Notice that the graph columns listed as "selected" in the grid customizer are not shown as columns. The next step will cover displaying graphs.
