| Chart / Graphical display of Cohorts that change during a study | rpiercy | 2022-12-14 04:29 | |||||||||||||||||
| Status: Active | |||||||||||||||||||
I have set up a visit based study with initially 3 Cohorts of participants. During the study 2 more separate Cohorts are generated from within one of the existing Cohorts to make 5 final cohorts. (i.e. some participants start in one cohort and then shift into two others, as their treatments change). Setting this up with automatic cohort assignment with a dataset and visits seems straightforwards. However, when I try to view the data within any dataset graphically with time on the X axis and with participants grouped according to their cohort at any given time, it seems not to recognise that the cohorts change. Is this actually possible to view graphically please (with correct cohort assignment at different times)? I am using Labkey server 21.7. Thank you. Richard |
|||||||||||||||||||
| |||||||||||||||||||
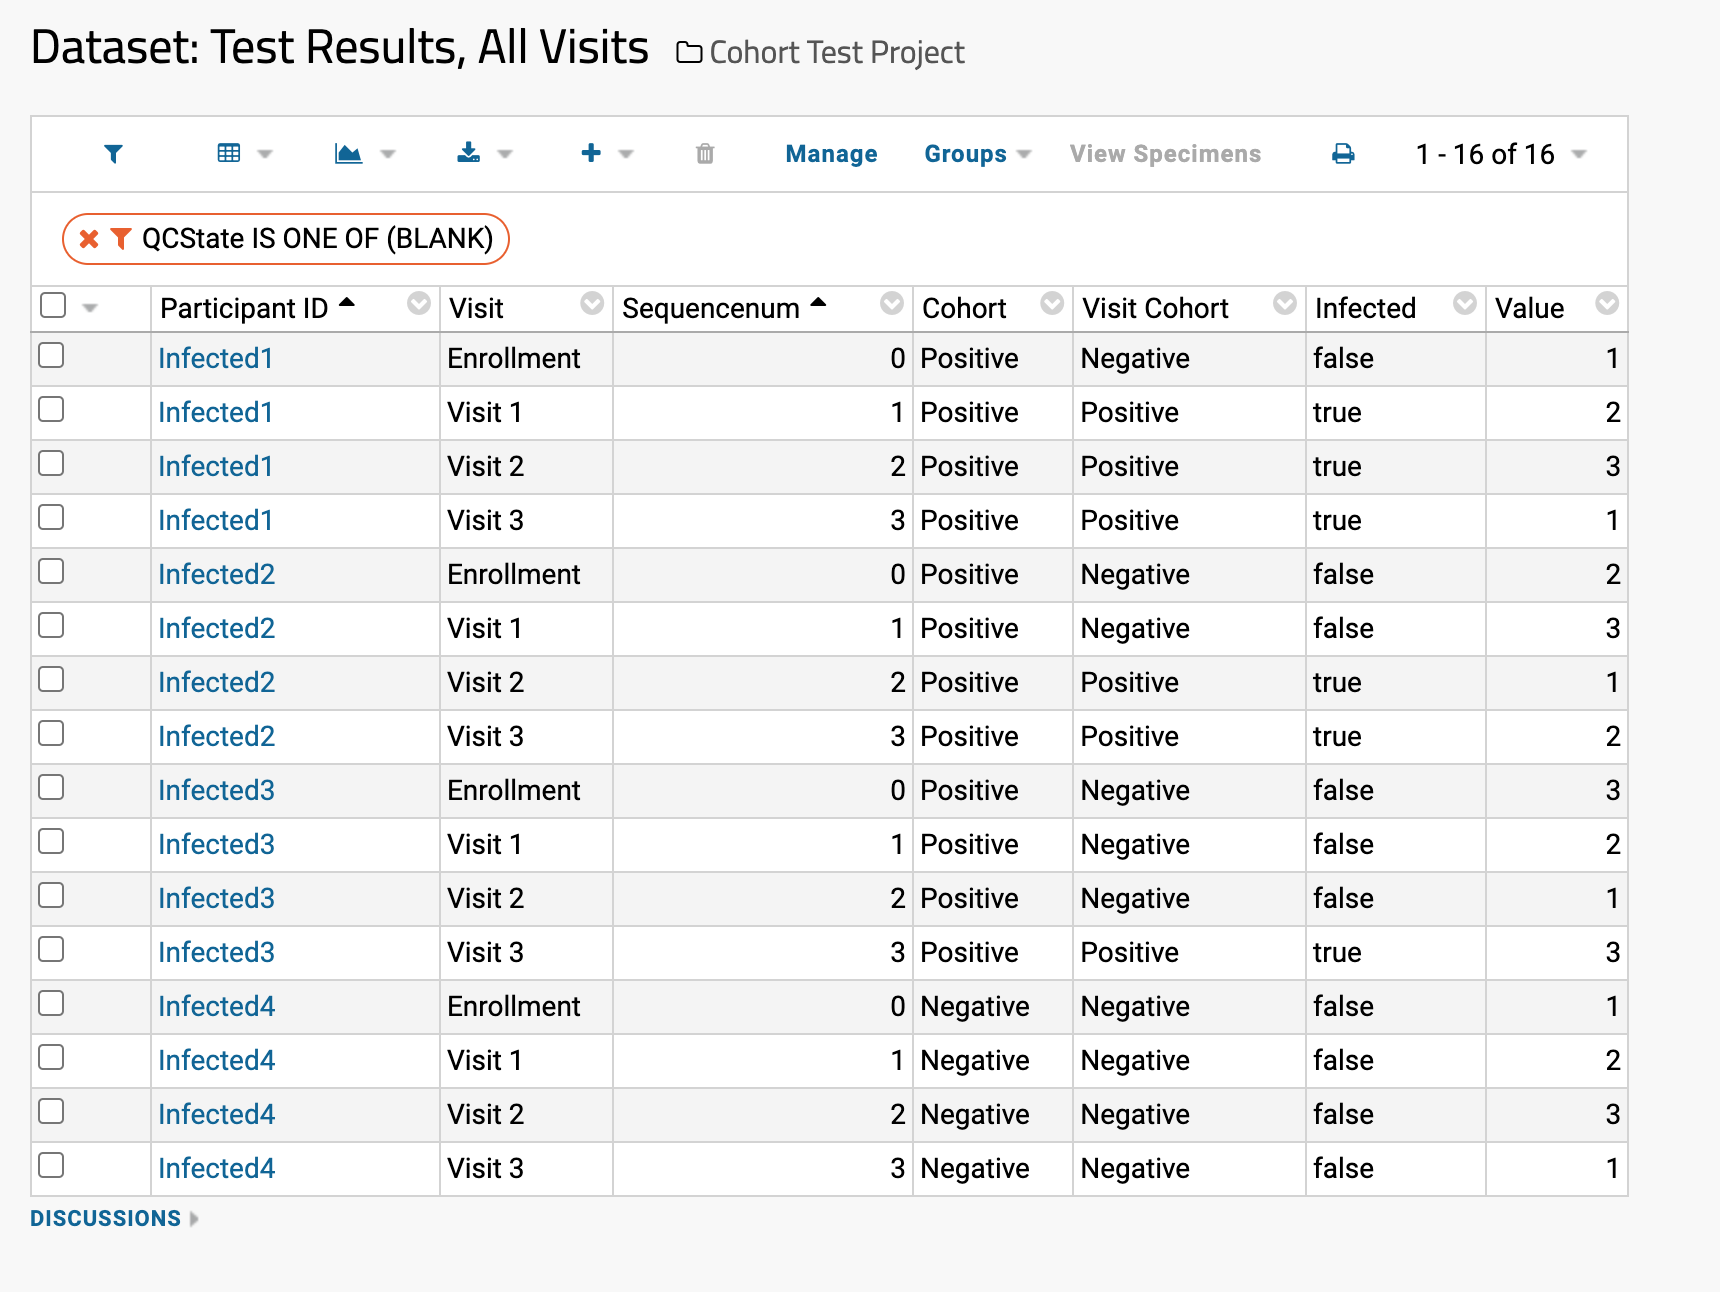 Screen Shot 2022-12-15 at 9.50.42 AM.png