Profiler Settings |
2025-07-15 |
This topic covers profiling tools built in to LabKey Server. These tools can be enabled when needed and are disabled by default as they may take space in the user interface or incur unnecessary overhead.
 To review stack traces captured via this mechanism, you can use the MiniProfiler, or view them in the Queries diagnostics interface from the Admin Console.When Tomcat is restarted or the web app is redeployed, this setting will revert to the default and only capture stack traces for exceptions.Developers can add new tracking code for stack traces by using "MiniProfiler.getTroubleshootingStackTrace()". This function will return NULL if tracing is disabled and a trimmed version of the trace if it is enabled.
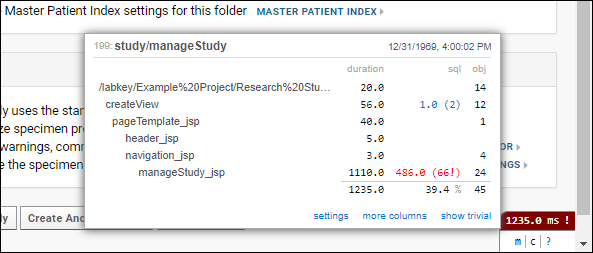
 Duplicate queries will be highlighted.
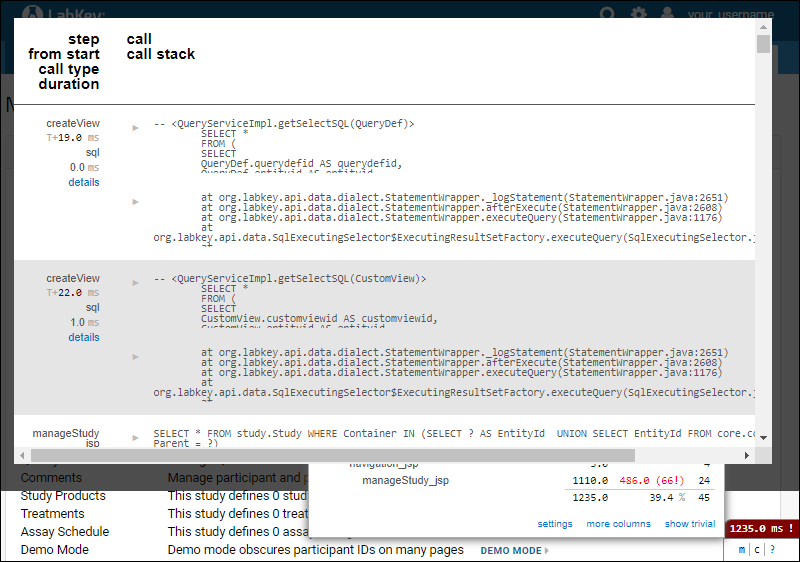
 Clicking on the link in the sql column will bring up the queries page showing each query that was executed, it's duration, and if enabled, a stack trace showing where the query originated.
Stack Trace Capture
Stack traces can provide useful diagnostics when something goes wrong, but can also incur high overhead when everything is going right. Stack traces are always captured for exceptions, but can also be enabled for routine actions like queries and ViewContext creation. Such traces can be helpful in tracking down memory leaks or ResultSet closure, but impose a performance hit. By default, stack traces for routine/non-exception actions are not captured, but you can enable them for the current server session if needed for troubleshooting. To enable non-exception stack trace capture:- Select > Site > Admin Console.
- Under Diagnostics, click Profiler.
- Check the box to Capture stack traces until server shutdown.
- Click Save.
MiniProfiler
The MiniProfiler tracks the duration of requests and any queries executed during the request. It is available on servers running in dev mode or for platform developers in production mode. Site administrators also have access to the profiler whenever it is enabled.
The LabKey MiniProfiler is a port of the MiniProfiler project.
Configure the Profiler
To enable or disable the mini-profiler:
- Select > Site > Admin Console.
- Under Diagnostics, click Profiler.
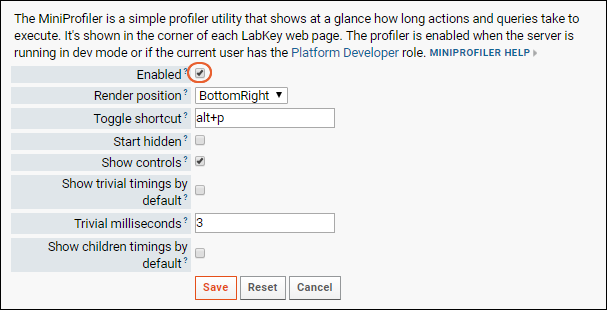
- Check the box for Enabled and configure desired settings.
- Click Save.
Profiler Settings
- Enabled: Check the box to enable the profiler.
- Render Position: Select the corner in which to display it. Default is bottom right.
- Toggle shortcut: Show/hide the MiniProfiler widget using a keyboard shortcut. Enter 'none' to disable toggling. The default is 'alt+p'.
- Start hidden: Check the box if you want the profiler to be hidden until toggled on. Default is that it is shown until toggled off.
- Show controls: Check the box to show the minimize and clear controls in the mini-profiler widget.
- Show trivial timings by default: Check the box to show the timings defined to be trivial by the next setting. Default is not to show trivial timings.
- Trivial milliseconds: Timings that are less than this value are considered trivial and will be greyed out.
- Show children timings by default: Check to display inclusive timings by default.
Using the Profiler
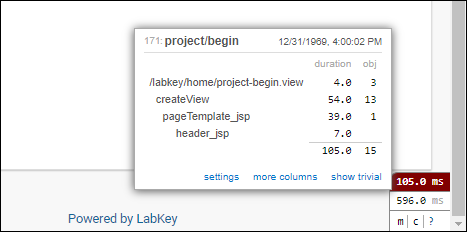
When enabled, the profiler adds a little widget to one corner of the page. For every page render or AJAX request, a button showing the elapsed time the request took is added to the profiler. Clicking on the time will bring up some summary details about the request. Duplicate queries will be highlighted.
 Clicking on the link in the sql column will bring up the queries page showing each query that was executed, it's duration, and if enabled, a stack trace showing where the query originated.