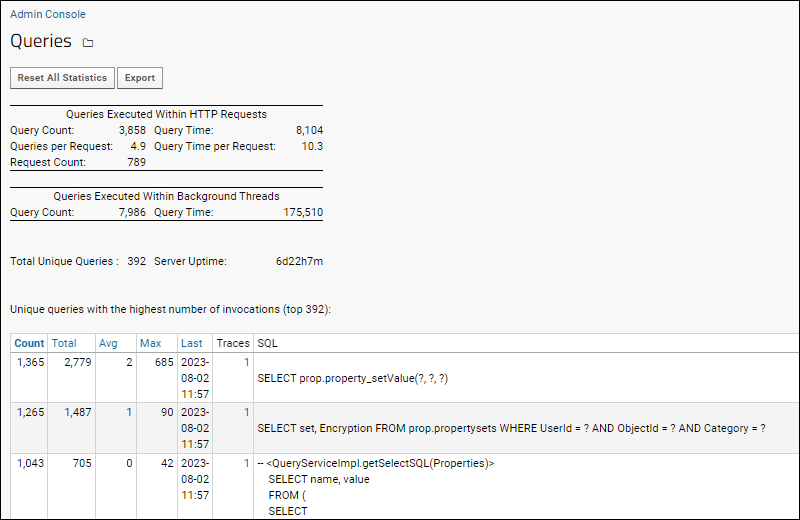
LabKey Server monitors the queries that it runs against the underlying database. For performance and memory usage reasons, it does not retain every query that has ever run, but it attempts to hold on to the most recently executed queries, the longest-running queries, and the most frequently run queries. In the vast majority of cases, all of the queries of interest are retained and tracked.
This information can be very useful for tracking down performance problems caused by slow-running database queries. You can also use the query profiler to see details about any queries running on your server and on some databases, see an estimated execution plan as well as actual timing.
View the Query Log
To view the query log:
- Select > Site > Admin Console.
- Under Diagnostics, click Queries.
You will see two summary sections and data.
- Queries Executed within HTTP Requests: Including Query Count, Query Time, Queries per Request, Query Time per Request, Request Count.
- Queries Executed Within Background Threads: Including Query Count and Query Time.
- Total Unique Queries
- Server Uptime
All statistics here can be reset by clicking
Reset All Statistics. Export the information to a TSV file by clicking
Export.

Below the summary statistics, you'll see a listing of the
unique queries with the highest number of invocations. Sort this list of queries by clicking the column headers:
| Column Name | Description |
|---|
| Count | The number of times that the server has executed the query since it started, or statistics were reset. |
| Total | The aggregate time of all of the invocations of the query, in milliseconds. |
| Avg | The average execution time, in milliseconds. |
| Max | The longest execution time for the query, in milliseconds. |
| Last | The last time that the query was executed. |
| Traces | This column will show the number of different call stacks from the application code that have invoked the query. If capture of stack traces was enabled on your server at the time of the query, clicking the link shows the actual stack traces, which can be useful for developers to track down any issues. |
| SQL | The query itself. Note that this is the actual text of the query that was passed to the database. It may contain substitution syntax. |
Troubleshoot Performance
To troubleshoot performance of an action, script, or application, particularly if you are not sure which query might be causing a slowdown, you can
Reset All Statistics here, then return to execute the action(s) of interest. When you return to this page, the statistics will report a more focused view of the recent actions.
For the cleanest report, you'll want to use two browser windows. In the first one, open the area that you want to profile. In the second, open the query profiler. Reset all statistics in the query profiler, then in the first browser, perform the action/query. After it completes, refresh the second browser tab and you will now see all the queries that took place during your action.
Click the
Max column header to see the queries that took the most time. You can also examine any
traces to find out more about particular query invocations.
Traces
In addition to performance issues, query profiling can help identify possible problems with many actions and queries. To trace an action, have two browser windows open:
- In one, Reset All Statistics on the query page.
- In the other, execute only the action you want to trace.
- Back in the first browser, refresh and examine the list of queries that just occurred.
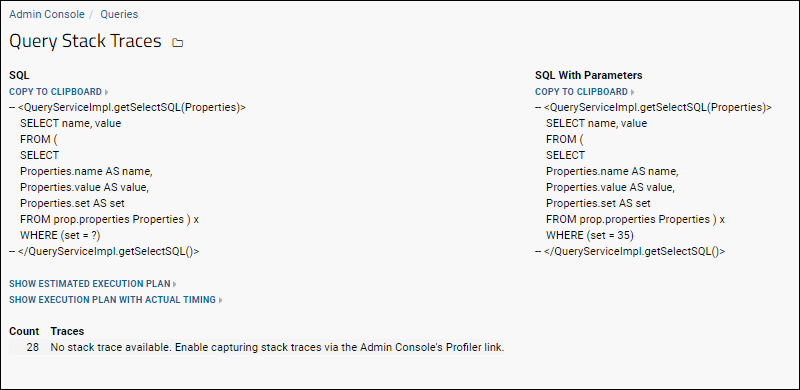
Clicking on a link in the
Traces column will show a details page.

It includes the raw text of the query, as well as one example of actual parameter values that were passed. Note that other invocations of the query may have used other parameter values, and that different parameter values can have significant impact on the runtime performance.
Either panel of trace details can be saved for analysis or troubleshooting by clicking
Copy to Clipboard and pasting into a text file.
Show Estimated Execution Plan
Below the trace details, you can click
Show Estimated Execution Plan to get the execution plan of the query as reported by the database itself. It will give you an idea of the cost, row estimate, and width estimate. While less accurate than showing the
actual execution plan, it will run quickly.

Note that on some databases, this option may not be available and the link will not be shown.
Show Execution Plan with Actual Timing
Click
Show Execution Plan with Actual Timing below the trace details, to see the cost estimate as well as the actual time, rows, and number of loops. The split between planning and execution time is also shown. This option requires running the query, so if you are diagnosing issues with a very long running or failing query, you may want to use the
execution plan estimate first.

Watch for differences between the estimate and the actual number of rows in particular. Significant mismatches may indicate that there is a more efficient way to write your query.
View pg_stat_activity and pg_locks
Troubleshooters and site or app administrators can also view the contents of the underlying posgres tables
pg_stat_activity and pg_locks from the
Admin Console's diagnostics section.
Related Topics