Charts not displaying correctly

LabKey Support Forum
Charts not displaying correctly bront  2018-09-04 09:44
Status: Closed
 

hi,

After upgrading to 18.2, I notice that charts aren't displaying correctly. Oddly, the data is is being displayed, but there are no graphics representing the bars or pieces of the pie charts (see attachment).

Here are the required files that worked prior to the upgrade:

"clientapi/ext4/Util.js",
"clientapi/ext4/data/Reader.js",
"clientapi/ext4/data/Proxy.js",
"clientapi/ext4/data/Store.js",

Here are the files I am requiring additionally in my efforts to fix the issue:

"vischart.min.js",
"vis/genericChart/genericChartHelper.js",
"vis/lib/crossfilter-1.3.11.min.js",
"vis/vis.min.js"

I am using the following to create the charts:

Ext4.create('Ext4.chart.Chart', { })

Am I missing a CSS file? Should I be using LABKEY.vis or LABKEY.chart? Something else?

Thanks for your help.

bront
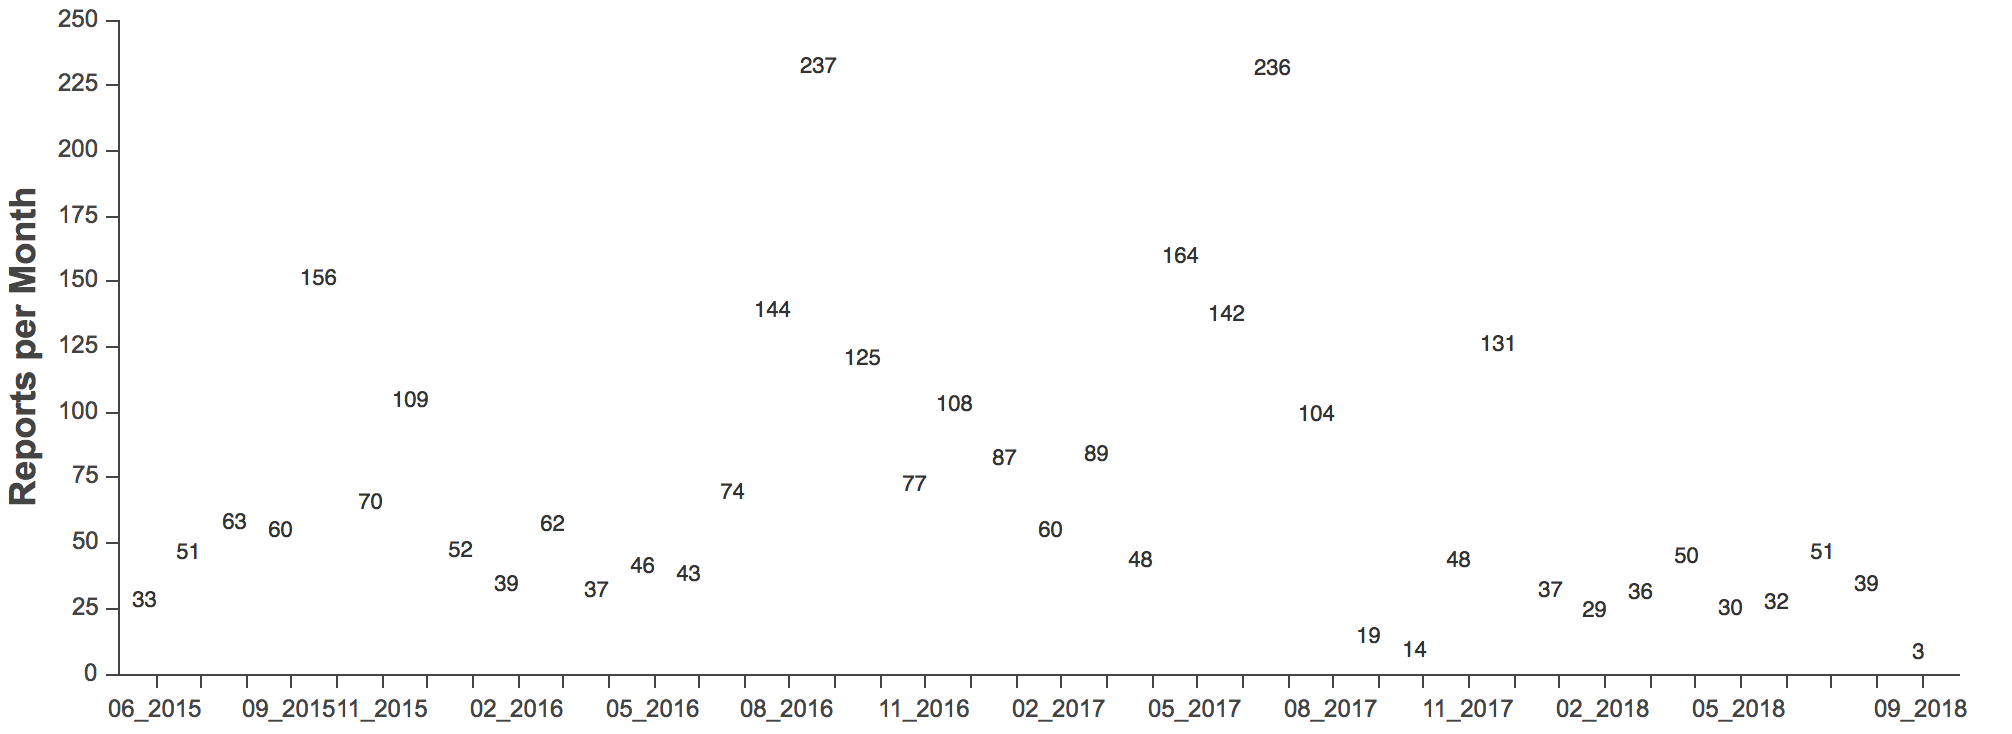
 
 
cnathe responded:  2018-09-04 09:54

Hi Bront,
I would assume, as you are, that this is a JS or CSS dependency issue. Are you getting any errors in the browser console window that might help identify which one?

Also, are you loading / listing the dependencies in a related xml file or in the JS code? If from an xml file, I believe you'll want to make sure that the following is included: <dependency path="vis/vis"/>. If from the JS code, try using the LABKEY.requiresVisualization helper as that should pull in all necessary files instead of having to list them out individually.

Thanks,
Cory

 
bront responded:  2018-09-04 10:14

Hi Cory,

I am not seeing any console errors, and I am loading dependencies via JS in a wiki page.

Is this how I should be using the requiresVisualization helper?

LABKEY.requiresScript(javaScriptFiles, function() {

LABKEY.requiresVisualization(function() {
    
    Ext4.onReady(function() {
        
    })
    
})

});

It seems to be loading the vis library (see attachment), but no changes to the charts on the page.

Thanks for your help.

bront

 
Nick Kerr responded:  2018-09-05 10:41

Hi Bront,

After further investigation I've opened issue #35368. In short, a css override is causing Ext.chart.Chart's to not display the contents of the chart.

Thanks,
Nick