Table of Contents |
guest 2026-03-22 |
ELISA Run 1 Details
ELISA Assay Data
Other Options: Join Related Data
Other Options: Visualize Results
Other Options: QC Trend Reporting
Data Harmonization Workflow
Quality Control - Cell Culture
T Cell Culture - Media Comparison
Analysis - Tabular Format
Media Comparison
Explore an Assay Data Workflow
- Data Dashboard
- QC
- Analysis
- Results
Learn More:
When you are ready to try working with your own assay data, you can create your own 30 day hosted trial of LabKey Server and start setting up customized assay designs and uploading data.
If you would like additional information, or a demo of a specific application of interest to you, please request a demo.
ELISA Run 1 Details
ELISA Assay Data
Other Options: Join Related Data
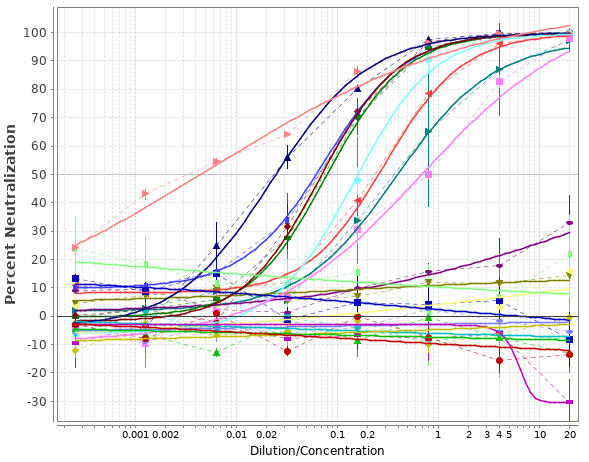
Other Options: Visualize Results
Quick visualizations of instrument data results can help validate data and communicate findings. Here are a few samples. Click to see the data.

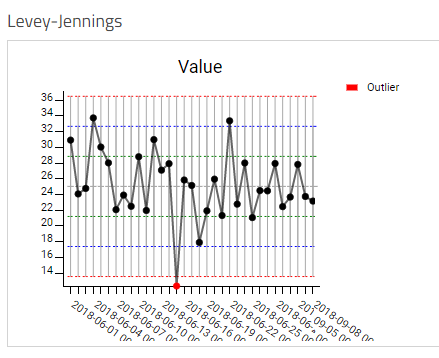
Other Options: QC Trend Reporting
Track the performance of analytes or equipment using QC trend reporting tools like these Levey-Jennings plots. Click to explore the plot.
Data Harmonization Workflow
Transformations to harmonize data from different contributors remove manual cleaning steps and reduce the chances of errors.
- Submitted data is shown in two tables: Cell Culture Runs and Cell Culture Results (below).
- In the Files panel (right), contributors can drop files for analysis.
- Continue to the QC tab to see quality control rules applied to the data.
Quality Control - Cell Culture
The QC Analyst reviewing the data for Group 4, discovered that the cells died, including those in the control media, indicating an issue unrelated to the media being tested. This violated the QC criteria, so the run was marked "Reviewed - Rejected", and is excluded from the final analysis.
- Results - Passed QC Review - Analysis is based on these results.
- Results - Did Not Pass QC Review - Excluded from analysis.
- Results - Not Yet Reviewed - These results are not yet included in the analysis.
The number of replicate samples per media is shown here: Number of Replicates
Fine-grained permissions are available corresponding to different roles in a Lab organization, such as "QC Analyst", for setting quality control states. Administrators also have the option to hide data based on QC state -- not done here so that you can browse all the data.
T Cell Culture - Media Comparison
LabKey's assay solutions are highlighted in this data portal, including:
- a custom assay designs to capture the experimental results and metadata
- a data file drop where submitters can contribute experimental results
- quality control markers to filter out invalid data
- analyses displayed in both visual and tabular formats
A Framework for Media Comparison
This experiment provides a framework for evaluating and optimizing media recipes for T cell cultures. Different media components and ingredient ratios can be compared against one another to help support research into T cell-based therapies, especially researchers pursuing serum-free and animal-free media formulations.
Two different media for T cell cultures are compared here. Data results from other media experiments can easily be added, if desired.
Experimental Protocol
T cells were cultured over 14 days using a generic cell culture protocol.
Media recipes compared:
- Media X - An off the shelf chemically-derived media, with no animal components. Designed for day 7 harvesting of cells.
- Media Y - An off the shelf chemically-derived media, with no animal components. Designed for day 14 harvesting.
- Control - no media used in culture.
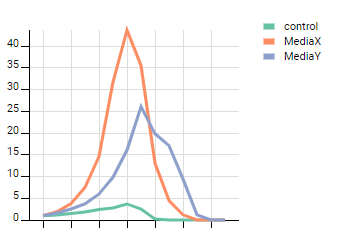
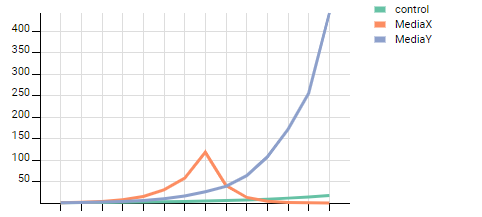
Analysis Results
Media X performance peaked at day 7 (as documented by the supplier). Media Y peaks at day 14. In terms of absolute cell production, Media Y outperformed the control and Media X.
All data presented here is fictional and was created by random number generators.
Analysis - Tabular Format
Media Comparison
Mean Cell Counts |