Once one or more freezers have been configured in your system, you can view the main Freezer Management dashboard from the
Storage option on the main menu.

From this
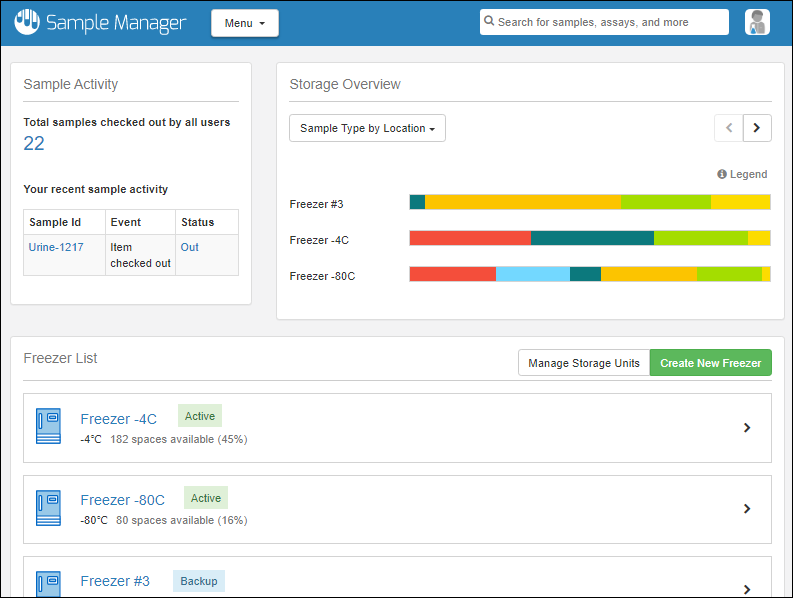
Storage Dashboard, you can see an overview and manage your sample storage.

Sample Activity

The
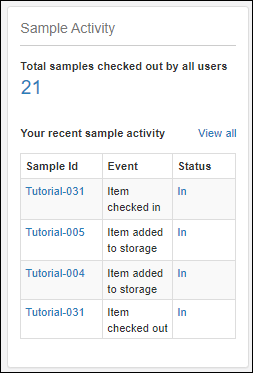
Sample Activity panel shows the number of samples checked out by all users. When non-zero, this is a clickable link taking you to the
Stored items page filtered to show "Storage Status = Checked out". Learn more in the topic:
View Storage ActivityYou will also see a grid of details about recent activity for the current user, showing up to 10 recent actions. Included here:
- Adding samples to storage
- Checking samples in or out
- Discarding samples from storage
The
Status column shows the current status of each sample mentioned here. For example, if you first checked a sample out and then checked it back in again, both activity lines will show the status "In".
You can view the full listing of all your sample Storage Activity by selecting
Storage Activity from the user menu. Learn more here:
View Storage Activity.
Storage Overview
The
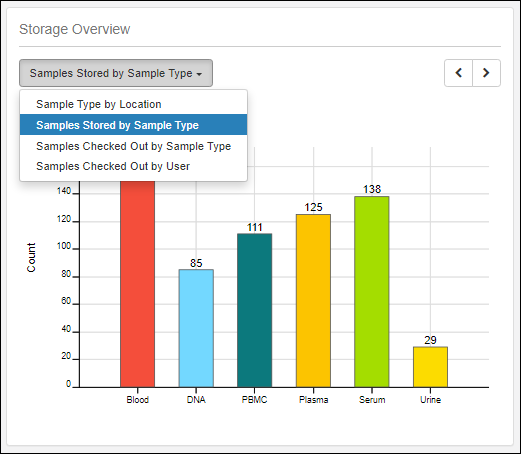
Storage Overview panel includes a graphical, color-coded representation of the current storage of samples in your freezers. The color you assign to each Sample Type is used to represent those samples in a variety of charts. Use the dropdown to select one:

- Sample Type By Location: The types of samples stored in each freezer, with the length of each colored bar segment representing the proportion of stored samples that are of the type represented by that color.
- Hover over the Legend for a guide to the colors on the "Sample Type By Location" chart.
- Samples Stored By Sample Type: A bar chart with the total count of each sample in all freezers shown.
- Samples Checked Out By Sample Type: A bar chart representing the types of samples currently checked out to all users.
- Samples Checked Out By User: A bar chart showing the total samples checked out to each user, regardless of Sample Type. Color coding is not used on this chart to represent Sample Type, but if you click the bar for a user, you will see a grid of the samples that user has checked out.
Within any chart, if you hover over a colored segment, you will see a tooltip with the count and type of sample it represents. Click any bar segment to see a grid of data for the samples it represents.
Freezer List
The freezer list shows buttons for the following actions, above a list of freezers available:
- Manage Storage Units: Define the "terminal" storage units in which you store your samples. Boxes, bags, canes, plates, and tube racks can be of different sizes and storage layouts.
- Create New Freezer: Add another freezer.
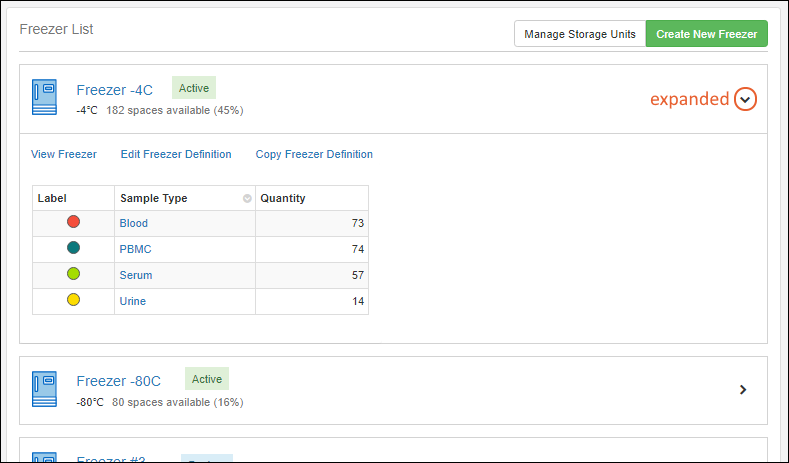
In the section for each freezer you have defined, an expandable panel includes:
- Freezer Name: Click the name to open the details for this freezer.
- If set, the Status will be displayed.
- Configured set-point temperature.
- Capacity to store more samples expressed as both:
- The number of spaces available, calculated using the total capacity of all terminal storage units in the freezer, minus the number of stored samples.
- The same calculation expressed as a percentage of storage available.
- Click the to expand and see details and actions:

- View Freezer: Click to view details and manage this freezer.
- Edit Freezer Definition: Edit the definition of this freezer.
- Copy Freezer Definition: Copy this freezer's properties and hierarchy to create a new empty freezer.
- A grid detailing the samples stored in this freezer, showing the Label color, Sample Type, and Quantity.
Related Topics
 From this Storage Dashboard, you can see an overview and manage your sample storage.
