Table of Contents |
guest 2025-05-02 |
List of Steps
1. Sort/Filter - Interactive Data
2. Chart the Data
3. Correlate Data
4. Compare Performance
5. Drill Down - Individual Participant Data
6. Integrate Heterogeneous Data
What's Next?
Administrator Tutorials
Start Here
|
A Quick Sample of LabKey Server This interactive tour shows you just a few of the ways that LabKey Server can help you:
|
|
|
|
List of Steps
First Step
================================================================1. Sort/Filter - Interactive Data
LabKey Server's interactive data grids let you, and colleagues, explore data securely online. Permissions can be set at the container, grid, or row level as needed. Only authorized users will see any data, and those who can have many analysis options.

What are the Highest CD4+ Values?
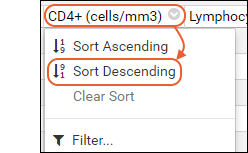
- Click CD4+ (cells/mm3) and select Sort Descending.

- Sort another column (especially ParticipantId) -- notice the first column retains partial sorting order.
Filter Records and Export
- Click ParticipantId and select Filter.
- In the filter panel, deselect All.
- Select a few individual participants and click Ok.
- Only the selected participants are displayed in the grid.
- Click Export, select a format, and download the data.
Previous Step | Next Step
2. Chart the Data
Colleagues can create and export their own visualizations
of the data. Authorized users can share these visualizations with selected colleagues.If you already know how you want to visualize results, you can easily tailor a custom plot. If you aren't sure, LabKey can make a "best guess" to get you started. A "quick chart" is an example of this "best guess" for a single column of data.

What is the Range of CD4+ Values?
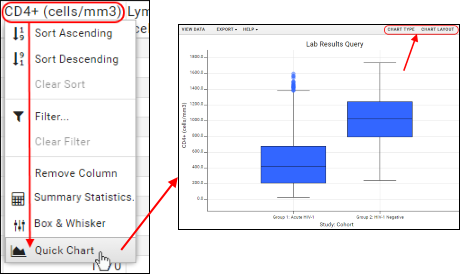
- Click CD4+ (cells/mm3) and select Quick Chart. (Click your browser's Back button to return to this page.)

- Hover over the box plots for the exact quartile ranges.
- Note that you can refine the plot in several ways by clicking Chart Type and Chart Layout.
Exclude and Rechart
- Quick charts respect your data filters. Exclude values with a filter and see the results by making another quick chart.
Previous Step | Next Step
3. Correlate Data
Data correlations are made visible with "scatter plots", which let you see data plotted in two dimensions (or three if you include color coding).
View and Export the Underlying Data
- Hover over any point for a tooltip showing the details.
- Click View Data to see all the underlying data.
- Click View Chart to return to the visualization.
- Hover over the visualization, then click the (Export to PDF) icon to download the image to your local machine.
Change Color Coding
Note: In this step, you may leave this panel view, so when finished, click 3. Correlate in the upper right to return to this tour.- In the scatter plot to the left, click Edit to change the plot. You must be logged in to edit.
- Click Chart Type, then drag the column Participant Group: Treatment Group to the Color box to replace Cohort.
- Click Apply to view the plot now color coded in another way.
- Click 3. Correlate in the header to return to the tour when finished.
Previous Step | Next Step
4. Compare Performance
How do cohorts and groups perform over time?
Performance Over Time
- Select different groups in the filter panel to see how their CD4+ level change over time.
- How do Females and Males compare?
- How do the different Countries compare?
- Close the Filters panel to expand the rendering area.
Previous Step | Next Step
5. Drill Down - Individual Participant Data
Authorized colleagues can browse anonymized data for individual participants. All of the the data shown here has been anonymized with:

- randomized participant ids.
- randomly shifted date values - shifted in a manner that preserves the relative date values, but obscures the absolute date values.
Browse Individual Participant Data
- Click a (expansion) icon to see inside a dataset.

- Some participant views include visualizations.
Previous Step | Next Step
6. Integrate Heterogeneous Data
You can easily join together columns from different tables to form joined, integrated tables. In many contexts, grids are joined 'behind the scenes' using common columns like participant or cohort identifiers.
Integrate Data from Different Tables
- Click the (Grid Views) icon and select Customize Grid.
- The left pane shows available columns, including columns from other datasets.
- Expand the node Participant ID and select Cohort. (This is a column from a different dataset: "Demographics".)
- Click View Grid.
- Notice that the columns are added to the Physical Exam table, creating a hybrid dataset.
Exclude and Visualize
- Click the Cohort column header and select Filter.
- Exclude one of the cohorts.
- To visualize, click CD4+ and select Quick Chart.
- Or choose another option from (Reports and Charts) -- many other visualization options are available.
Previous Step | Next Step
What's Next?
|
To set up your own 30-day free trial version of LabKey Server, see LabKey Server Trial. Also see the tutorial series designed for new users:
|
Administrator Tutorials
Get started working with your own data by installing LabKey Server:
- Data Analysis - Integrate and visualize data.
- Observational Studies - Track cohort performance, manage complex data requirements.
- File Management - Set up a secure, shareable file repository.
- Assay Data - Import and integrate assay and lab data.
- Specimen Request System - Set up a specimen repository and request system.