Table of Contents |
guest 2025-05-17 |
Step 1: Export Chart as JavaScript
Step 2: Embed the Script in a Wiki
Modify the Exported Chart Script
Display the Chart with Minimal UI
Tutorial: Visualizations in JavaScript
Once you have created a chart and filtered and refined it using the data grid and user interface, you can export it as JavaScript. Then, provided you have Developer permissions (are a member of the "Developer" site group), you can insert it into an HTML page, such as a wiki, and directly edit it. The powerful LabKey visualization libraries include many ways to customize the chart beyond features available in the UI. This lets you rapidly prototype and collaborate with others to get the precise presentation of data you would like.
The exported JavaScript from a chart will:
- Load the dependencies necessary for visualization libraries
- Load the data to back the chart
- Render the chart
In this tutorial, we will:
- Export Chart as JavaScript
- Embed the Script in a Wiki
- Modify the Exported Chart Script
- Display the Chart with Minimal UI
First Step
Related Topics
Step 1: Export Chart as JavaScript
This tutorial starts by making a time chart grouped by treatment group, then exporting the JavaScript to use in the next tutorial steps. This example uses the sample study datasets imported as part of our tutorial example study.
Create a Timechart
- Navigate to the home page of your sample study, "HIV Study." If you don't have one already, see Install the Example Study.
- Click the Clinical and Assay Data tab.
- Open the LabResults data set.
- Select (Charts) > Create Chart.
- Click Time.
- For the X Axis select Visit-Based.
- Drag CD4 from the column list to the Y Axis box.
- Click Apply.
- You will see a basic time chart. Before exporting the chart to Javascript, we can customize it within the wizard.
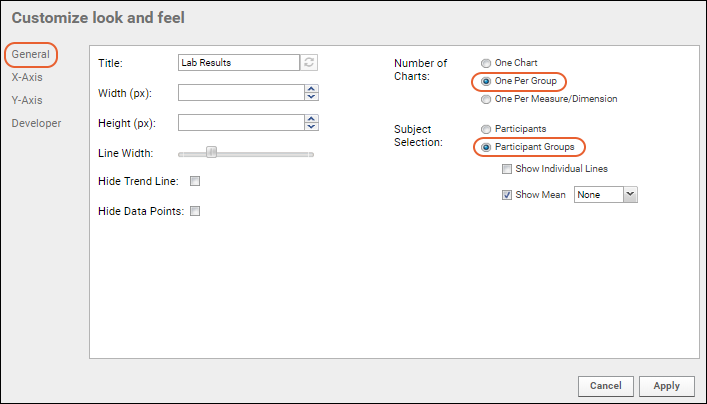
- Click Chart Layout, then change the Subject Selection to "Participant Groups". Leave the default "Show Mean" checkbox checked.
- Change the Number of Charts to "One per Group".
- Click Apply.
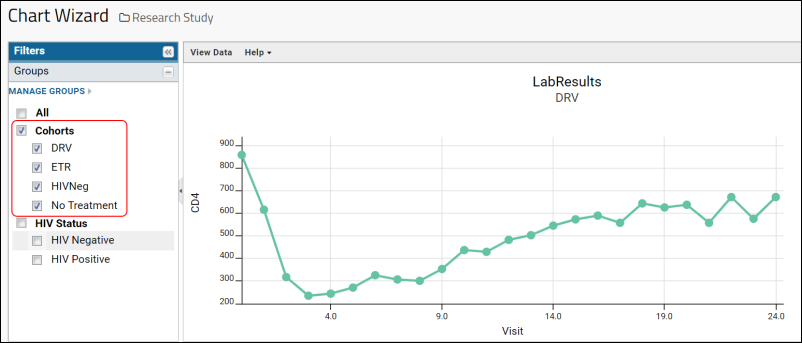
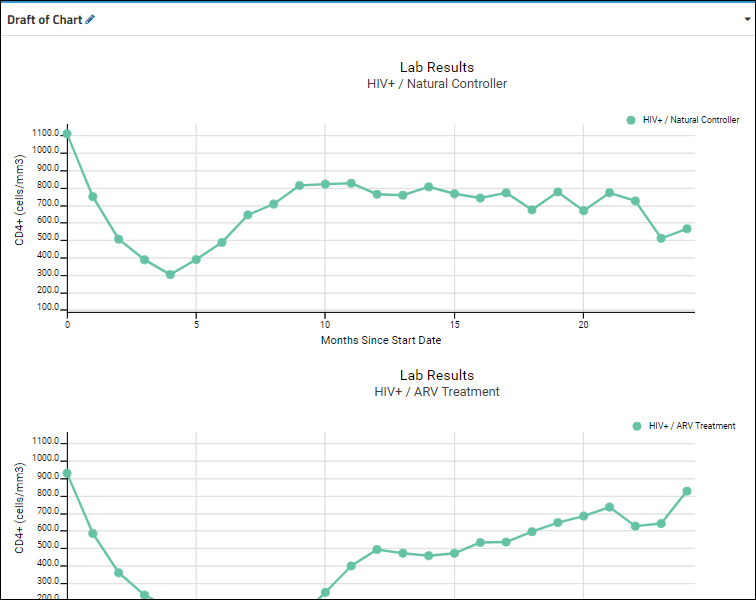
- In the Filters > Groups panel on the left, select Cohorts and deselect anything that was checked by default. The chart will now be displayed as a series of four individual charts in a scrollable window, one for each treatment group:

Export to JavaScript
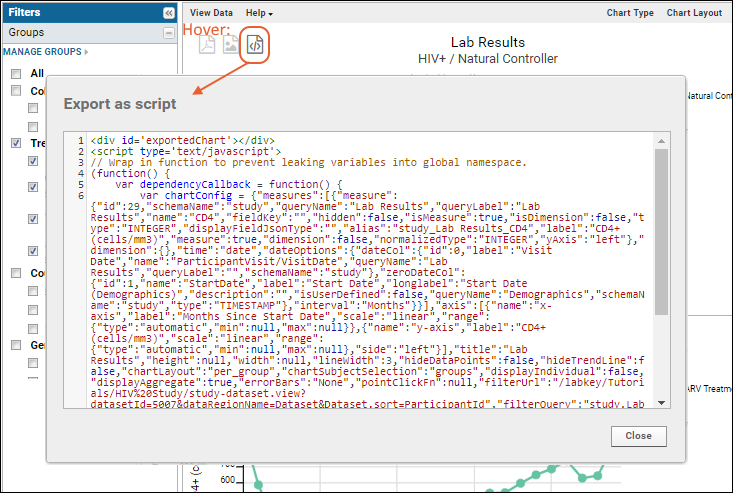
- Hover over the chart to reveal the Export buttons, and click to Export as Script.
- You will see a popup window containing the HTML for the chart, including the JavaScript code.

- Select All within the popup window and Copy the contents to your browser clipboard.
- Click Close in the popup. Then Save your chart with the name of your choice.
- Before proceeding, paste the copied chart script to a text file on your local machine for safekeeping. In this tutorial, we use the name "ChartJS.txt".
Start Over | Next Step (2 of 4)
Step 2: Embed the Script in a Wiki
You can embed an exported JavaScript chart into a Wiki or any other HTML page without needing to make any modifications to what is exported. To complete this step you must have either "Platform Developer" or "Trusted Analyst" permissions.
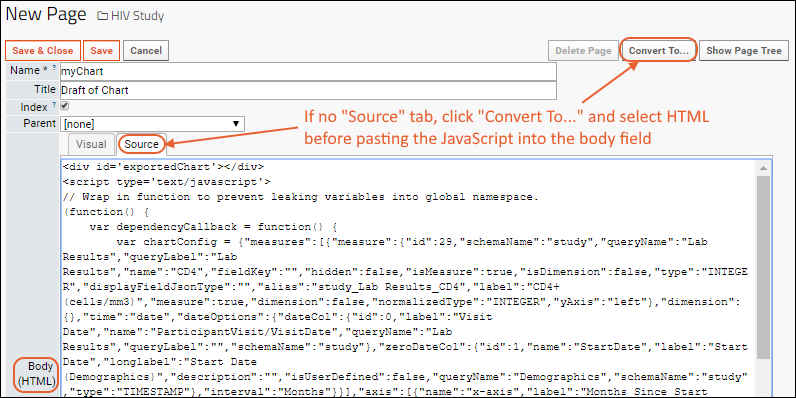
This topic is a continuation of the JavaScript Visualizations tutorial and begins with you holding the exported script on your clipboard or in a text file as described in the previous step.
- Click the Overview tab to go to the home page of your study, or navigate to any tab where you would like to place this exported chart.
- Add a Wiki web part on the left.
- Create a new wiki:
- If the folder already contains a wiki page named "default", the new web part will display it. Choose New from the web part (triangle) menu.
- Otherwise, click Create a new wiki page in the new wiki web part.
- Give the page the name of your choice. Wiki page names must be unique, so be careful not to overwrite something else unintentionally.
- Enter a Title such as "Draft of Chart".
- Click the Source tab. Note: if there is no Source tab, click Convert To..., select HTML and click Convert.
- Paste the JavaScript code you copied earlier onto the source tab. Retrieve it from your text file, "ChartJS.txt" if it is no longer on your browser clipboard.
- Scroll up and click Save.
- You could also add additional HTML to the page before or after the pasted JavaScript of the chart, or make edits as we will explore in the next tutorial step.
- Caution: Do not switch to the Visual tab. The visual editor does not support this JavaScript element, so switching to that tab would cause the chart to be deleted. You will be warned if you click the Visual tab. If you do accidentally lose the chart, you can to recover the JavaScript using the History of the wiki page, your ChartJS.txt file, or by exporting it again from the saved timechart.
- Scroll up and click Save & Close.
- Return to the tab where you placed the new wiki web part. If it does not already show your chart, select Customize from the (triangle) menu for the web part and change the Page to display to the name of the wiki you just created. Click Submit.
- Notice that the web part now contains the series of single timecharts as created in the wizard.
Related Topics
Previous Step | Next Step (3 of 4)
Modify the Exported Chart Script
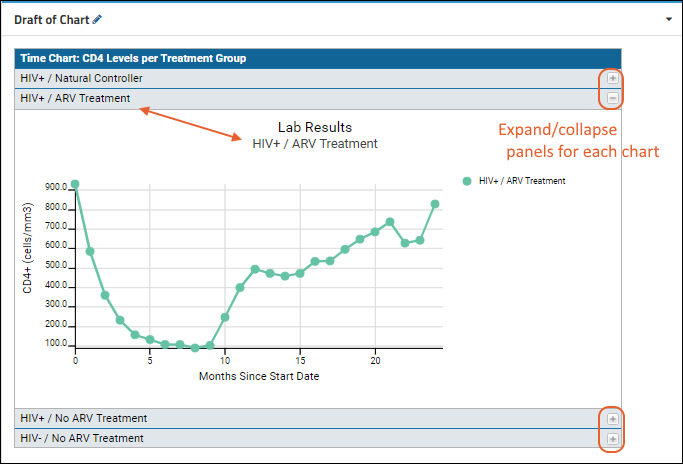
In this tutorial step we will modify the chart we created in the previous step to use an accordion layout and change the size to better fit the page.
Modify the Exported Chart Script
The chart wizard itself offers a variety of tools for customizing your chart. However, by editing the exported JavaScript for the chart directly you can have much finer grained control as well as make modifications that are not provided by the wizard.
- Open your wiki for editing by clicking Edit or the pencil icon if visible.
- Confirm that the Source tab is selected. Reminder: Do not switch to the Visual tab.
- Scroll down to find the line that looks like this:
LABKEY.vis.TimeChartHelper.renderChartSVG('exportedChart', queryConfig, chartConfig); - Replace that line with the following code block. It is good practice to mark your additions with comments such as those shown here.
// ** BEGIN MY CODE **
// create an accordion layout panel for each of the treatment group plots
var accordionPanel = Ext4.create('Ext.panel.Panel', {
    renderTo: 'exportedChart',
    title: 'Time Chart: CD4 Levels per Treatment Group',
    width: 760,
    height: 500,
    layout: 'accordion',
    items: []
});

// loop through the array of treatment groups
var groupIndex = 0;
Ext4.each(chartConfig.subject.groups, function(group) {
    // add a new panel to the accordion layout for the given group
    var divId = 'TimeChart' + groupIndex ;
    accordionPanel.add(Ext4.create('Ext.panel.Panel', {
        title: group.label,
        html: '<div id="' + divId + '"></div>'
    }));

    // clone and modify the queryConfig and chartConfig for the plot specific to this group
    var groupQueryConfig = Ext4.clone(queryConfig);
    groupQueryConfig.defaultSingleChartHeight = 350;
    groupQueryConfig.defaultWidth = 750;
    var groupChartConfig = Ext4.clone(chartConfig);
    groupChartConfig.subject.groups = [group];

    // call the plot render method using the cloned config objects
    LABKEY.vis.TimeChartHelper.renderChartSVG(divId , groupQueryConfig, groupChartConfig);

    groupIndex++;
});
// ** END MY CODE **
- Click Save and Close to view your new chart, which is now an "accordion panel" style. Click the and buttons on the right to expand/collapse the individual chart panels.
Previous Step | Next Step (4 of 4)
Display the Chart with Minimal UI
To embed an exported chart without surrounding user interface, create a simple file based module where your chart is included in a simple myChart.html file. Create a myChart.view.html file next to that page with the following content. This will load the necessary dependencies and create a page displaying only the simple chart. (To learn how to create a simple module, see Tutorial: Hello World Module.)
<view xmlns="http://labkey.org/data/xml/view" template="print" frame="none">
</view>
Finished
Congratulations! You have completed the tutorial and learned to create and modify a visualization using JavaScript.