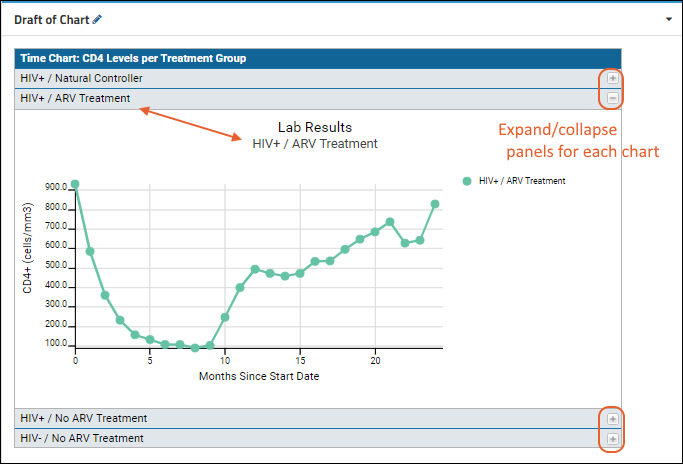
In this tutorial step we will modify
the chart we created in the previous step to use an accordion layout and change the size to better fit the page.
Modify the Exported Chart Script
The chart wizard itself offers a variety of tools for customizing your chart. However, by editing the exported JavaScript for the chart directly you can have much finer grained control as well as make modifications that are not provided by the wizard.
- Open your wiki for editing by clicking Edit or the pencil icon if visible.
- Confirm that the Source tab is selected. Reminder: Do not switch to the Visual tab.
- Scroll down to find the line that looks like this:
LABKEY.vis.TimeChartHelper.renderChartSVG('exportedChart', queryConfig, chartConfig);
- Replace that line with the following code block. It is good practice to mark your additions with comments such as those shown here.
// ** BEGIN MY CODE **
// create an accordion layout panel for each of the treatment group plots
var accordionPanel = Ext4.create('Ext.panel.Panel', {
    renderTo: 'exportedChart',
    title: 'Time Chart: CD4 Levels per Treatment Group',
    width: 760,
    height: 500,
    layout: 'accordion',
    items: []
});

// loop through the array of treatment groups
var groupIndex = 0;
Ext4.each(chartConfig.subject.groups, function(group) {
    // add a new panel to the accordion layout for the given group
    var divId = 'TimeChart' + groupIndex ;
    accordionPanel.add(Ext4.create('Ext.panel.Panel', {
        title: group.label,
        html: '<div id="' + divId + '"></div>'
    }));

    // clone and modify the queryConfig and chartConfig for the plot specific to this group
    var groupQueryConfig = Ext4.clone(queryConfig);
    groupQueryConfig.defaultSingleChartHeight = 350;
    groupQueryConfig.defaultWidth = 750;
    var groupChartConfig = Ext4.clone(chartConfig);
    groupChartConfig.subject.groups = [group];

    // call the plot render method using the cloned config objects
    LABKEY.vis.TimeChartHelper.renderChartSVG(divId , groupQueryConfig, groupChartConfig);

    groupIndex++;
});
// ** END MY CODE **
- Click Save and Close to view your new chart, which is now an "accordion panel" style. Click the and buttons on the right to expand/collapse the individual chart panels.
