This topic covers how to capture these sample-to-sample relationships in LabKey Server.
You can derive samples using the user interface, either by splitting samples up into smaller portions to create aliquots or mixing multiple samples together to create compounds. The user interface for both operations is the same, the difference being that for aliquots you would derive from a single parent, and compounds would be composed of multiple samples.

 Specify Source Materials:

There is also a link to Derive samples from this sample link on the details view of each individual sample, making creation of aliquots straightforward from here.
Within a Sample Type design, you can indicate one or more columns that contain parentage information. The parentage information can exist in the same or a different Sample Type. Parentage information can also exist in a Data Class. On import of new sample data, the Sample Type will look for the indicated column for the parentage information. Note that the column indicated is not actually added to the Sample Type as a new field, instead the system merely pulls data from indicated column to determine parentage relationships.
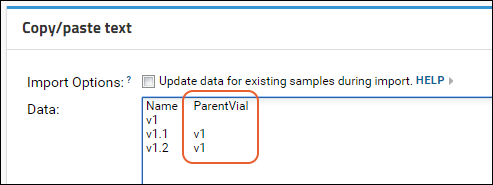
For example, if you want to import the following samples table:
| Name | ParentVial |
|---|---|
| v1 | |
| v1.1 | v1 |
| v1.2 | v1 |
You would indicate the parent column alias as "ParentVial" (see screenshot below).
To add parentage columns to a Sample Type:


The system will parse the parentage information, and create lineage relationships. Learn about lineage graphs below.

You can also update parent information during import (change or delete parents) by selecting the "Update data for existing samples during import" checkbox.
Learn more in this topic: Update or Remove Sample Lineage During Import
When importing samples, you can indicate parentage by including a column named "MaterialInputs/<NameOfSampleType>", where <NameOfSampleType> refers to some existing sample type, either a different sample type, or the current one. Note that the MaterialInputs column is not actually added to the Sample Type as a new field, instead the system merely pulls data from the column to determine parentage relationships. For example, the following indicates that DerivedSample-1 has a parent named M-100 in the sample type RawMaterials.
| Name | MaterialInputs/RawMaterials |
|---|---|
| DerivedSample-1 | M-100 |
You can point to parents in the same or different sample types. The following shows child and parent samples both residing in the sample type MySampleType:
| Name | MaterialInputs/MySampleType |
|---|---|
| ParentSample-1 | |
| ChildSample-1 | ParentSample-1 |
To indicate multiple parents, provide a list separated by commas. The following indicates that DerivedSample-2 is a mixture of two materials M-100 and M-200 in the RawMaterials sample type.
| Name | MaterialInputs/RawMaterials |
|---|---|
| DerivedSample-2 | M-100, M-200 |
You can indicate parents across multiple sample types by adding multiple MaterialInput columns. The following indicates that DerivedSample-3 has three parents, two from RawMaterials, and one from Reagents:
| Name | MaterialInputs/RawMaterials | MaterialInputs/Reagents |
|---|---|---|
| DerivedSample-3 | M-100, M-200 | R-100 |
Samples can be linked to Data Classes using a similar syntax. The following indicates that DerivedSample-4 is derived from an expression system ES-100
| Name | DataInputs/ExpressionSystems |
|---|---|
| DerivedSample-4 | ES-100 |
You can create a LABKEY.Exp.Run with parent samples as inputs and child derivatives as outputs.
By default a sample type does not display the parent columns, either the Material Inputs or the Data Inputs. To show these columns:

Derived samples are represented graphically using "lineage graphs". To view:
Samples are represented as rectangles and the derivation steps are shown as diamonds. Note that elements in the graph are clickable links that navigate to details pages. By default you will see the Graph Detail View:
If you click the Graph Summary View tab, you will see a different presentation of the same process and lineage.
Clicking Toggle Beta Graph (New!) from the Graph Summary View will give you a another way to view the same information. Click any node to reset the point of focus of this graph, explore details in the panel to the right, and zoom/resize the graph using the controls.
Note that lineage graphs can differ depending on the way that the data is entered. When you manually derive multiple child samples from a parent via the Derive Samples button, the lineage graph summary view will show these child samples on one graph, as shown below in a case where two additional samples have been derived from the "Derived Yeast Sample".
When the sample parent/child relationships are imported via copy-and-paste or via the API, separate lineage graphs will be rendered for each parent/child relationship. A single graph showing all the child sample simultaneously will not be available.
Subscribers to premium editions of LabKey Server can use the Run Builder to streamline creation of experiments with inputs and outputs: