The Registry forms the team's shared knowledge base, containing detailed information on your sequences, cell lines, expression systems, and other research assets. The Registry recognizes nine entity types:

When a new entity is added, the registry checks to ensure that the incoming entity is unique, in order to avoid the confusion that can result from duplicate entries.
Each entity type is organized into data grids that can be filtered, sorted, and searched to find items of interest.  A search bar above each data grid provides intuitive querying for entities. Data grids are customizable by administrators to show those columns that are most relevant to the research effort.
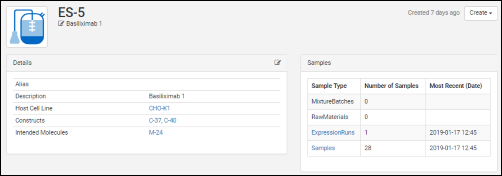
Click an entity in a grid to see its details page. Each details page shows the entity's properties and relationships to other entities.  Like data grids, administrators control what fields are shown. Different details pages can be configured for each entity type to show the most relevant data. For example, the details page for a protein sequence shows the chain format, average mass, extinction coefficient, the number of S-S bonds, etc., while the details page for a expression system shows the cell lines, constructs, and target molecule, as well as the samples drawn from it.
Each details page contains a panel of relationships to other entities. For example, for a given protein sequence, the relationship panel shows: 
Samples, media stocks, and other lab assets are stored in an inventory, organized into data grids and detail pages, similar to the way entities are stored in the Registry. Names for newly created samples are generated according to a pre-defined pattern controlled by administrators.  Sample names can be built up from elements such as dates, incrementing numbers, static text, project names, etc. For example:
The inventory system also understands sample vial relationships and lineage, that is, parent and child vials. A graphical view shows the upstream and downstream lineage of the current sample. The same information is also available in a grid form, which allows you to navigate via the parentage lines to related sample vials.
Samples can be grouped together into experiments, along with the result data and supporting files.  Charts and visualizations can also be added to experiments, charts which automatically updte when the underlying result data changes.
The inventory also lets you define both media recipes and real batches of media, so you can track current state of your lab stocks.
Analytics and visualizations are provided throughout LabKey Biologics to provide key insights into the large molecule research process. 
Protein Classification Engine
When new protein sequences are added to the Registry, they are passed to the classification and annotation engine, which calculates their properties and identifies key regions on the protein chain, such as leader sequences, variable regions, and constant regions. (Researchers can always override the results of the classification engine, if desired.) Results are displayed on the Sequence tab of the protein's detail page. Identified regions are displayed as multicolored bars, which, when clicked, highlight the annotation details below.
Visualizations
Administrators can attach visualizations to the assay result data, which are then automatically surfaced to users via the Charts button. Visualizations are handled by LabKey Server's reporting engine, which supports a wide array of visualization frameworks.

Custom Grids
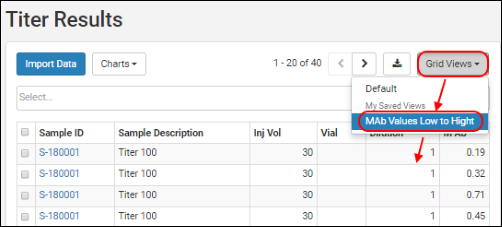
 Custom grids can also be configured by administrators, which are surfaced to users via the Grid Views button. Refine and export a data grid selected from this menu.