The
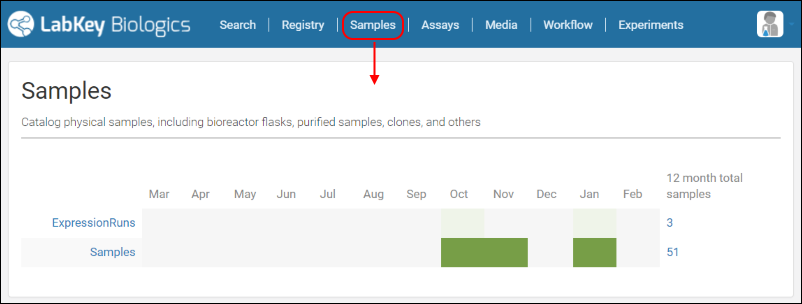
Samples home page displays a heat map of sample creation over the past twelve months. Color density represents the number of samples created in a given month.
Sample groups are displayed as rows,
Expression Runs and
Samples in the screenshot below.
Click a cell to see the samples created in a given month.

A sample grid shows the standard grid buttons such as
Create, Charts, Grid, etc., and can be sorted and filtered like other grids in the system.
Different sample groups are available as sub-tabs.
Click an individual sample to see its details page.

A sample
details pages shows three sub-tabs:
- Overview - Summary of sample information.
- Lineage - Shows the parents and children of the current sample, which is rendered in color.
- Assays - Displays any assay data associated with this sample. Multiple assays are displayed on different tabs, as shown below.

Sample lineage is available as a graphical view (shown below) or as grid. For details see
Entity Lineage.

Related Topics
 A sample grid shows the standard grid buttons such as Create, Charts, Grid, etc., and can be sorted and filtered like other grids in the system.Different sample groups are available as sub-tabs.Click an individual sample to see its details page.
 A sample details pages shows three sub-tabs:
 Sample lineage is available as a graphical view (shown below) or as grid. For details see Entity Lineage.