Scenario overview
LabKey Argos currently facilitates five scenarios:
- Browse and visualize available data across multiple dimensions, such as patient characteristics and specimen and study metadata
- Identify a population that matches a particular set of characteristics, such as those of a patient who has presented for treatment, and save for further investigation
- Review trends for this population
- Dig deeper into more detailed data for the selected population
- Comply with data confidentiality and security regulations that guard protected health information (PHI), such as HIPAA and FISMA
A sample of the data discovery and visualization tools included in the interface:
- Survival curves for comparing outcomes for different patient populations
- Timeline views for visualizing treatment events for individuals in selected population
- Accrual reports for forecasting how long it will take for patients with the set of characteristics needed for a future study to walk in the door
Ordinary users see a streamlined interface that helps them answer common questions quickly and independently. Highly technical users can still access the full LabKey Server toolbox, such as its querying, reporting and extensibility infrastructure, through the standard LabKey interface.

Screenshot Tour
Disease Portals
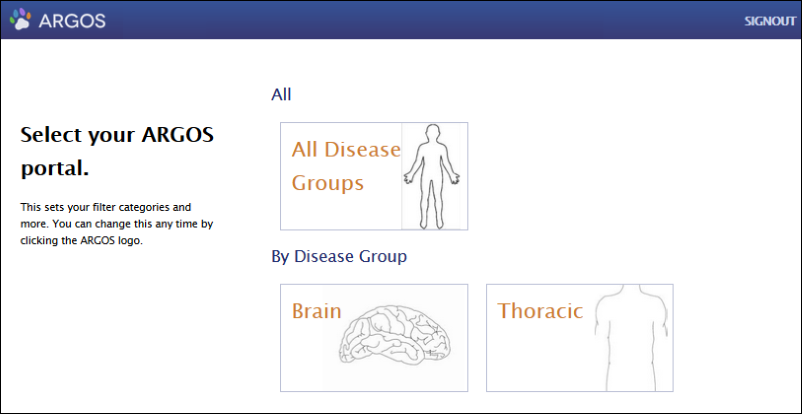
Argos provides customizable, group-specific portals to help researchers focus on the subset of data most relevant to them within an environment tailored to their particular kind of research.
Each portal displays dashboards tailored to a specialized area of research and can supply access to either a subset or all available data. Administrators configure access permissions, available data, and summary dashboards for each portal.
An investigator begins exploring available data by choosing a disease portal to browse. In this demonstration, we will explore the Brain Cancer Portal.
Login
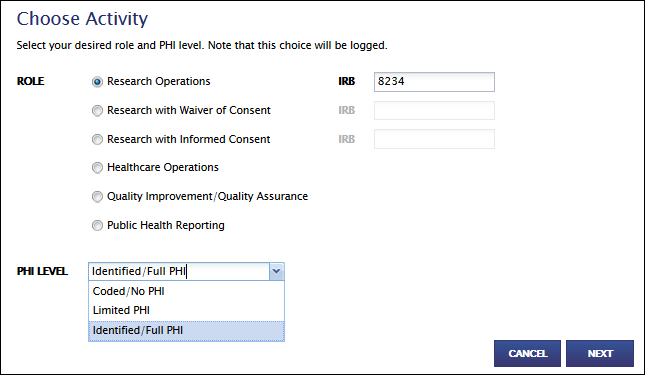
After choosing a disease portal, the user must log in and select their intended activity (why they need access to patient data), PHI access level (what level of patient identification is required), and IRB number (what permissions they have for data access/use). To protect patient confidentiality, researchers who do not need to see PHI can opt not to see it.
Terms of Use
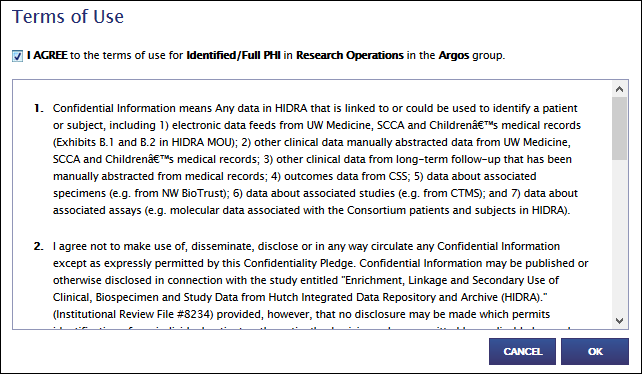
Argos also helps researchers comply with HIPAA and FISMA requirements by requiring users to log in under Terms of Use that are tailored to the user's intended activity, PHI level and IRB number. Once users have signed the Terms of Use, their activity is logged, including records of all PHI columns and participant IDs viewed, providing auditors with a clear picture of who has viewed which patient records and the terms of data access.
Dashboard
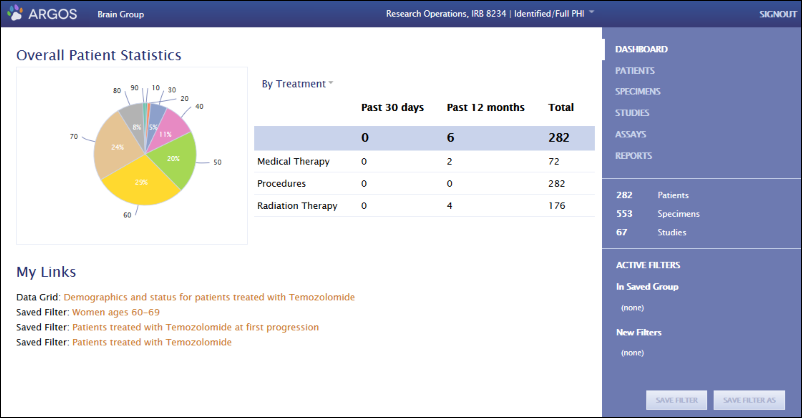
After login, a user sees the home Dashboard for the chosen disease portal.
The Dashboard provides a high-level overview of the available data within the portal and a
quick breakdown of patients in the disease group. Data summaries are customizable by administrators. The Dashboard also provides easy access to previously Saved Filters (groups of patients) and Saved Grids (detailed data for particular patient groups) in the lower left corner.
From the Dashboard, users can browse available data by different dimensions, such as Patients, Specimens and Studies (a.k.a. protocols), as shown in the upper right. We will start exploring by selecting "Patients" in the upper right.
Population Filters
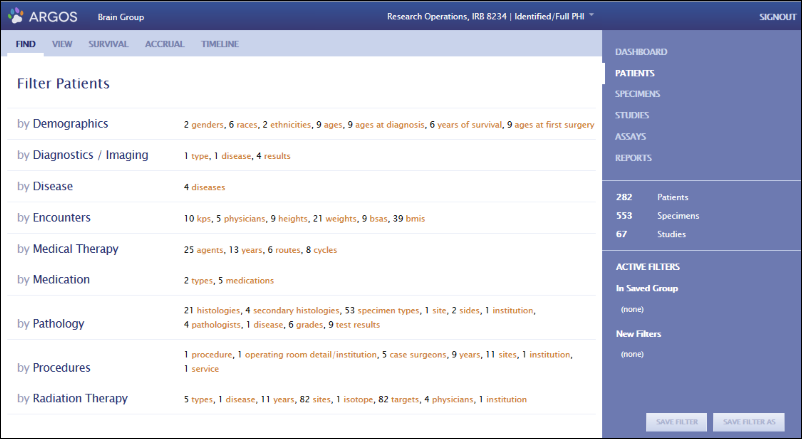
After selecting the Patient dimension, the user sees options for filtering the available patient population based on categories of characteristics, such as gender or radiation type.
Here we select Medical Therapy Agent, aiming to compare trends for patients treated with a specific medical therapy with the overall population of brain cancer patients whose data is contained in the portal.
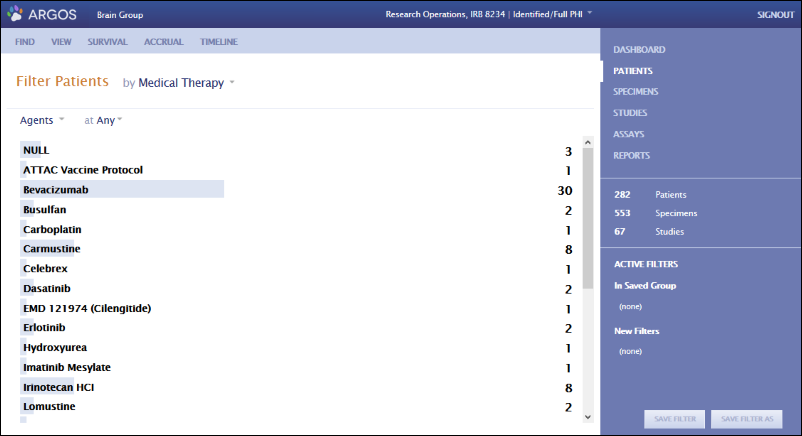
After we select this category, histograms show the number of patients with each characteristic.
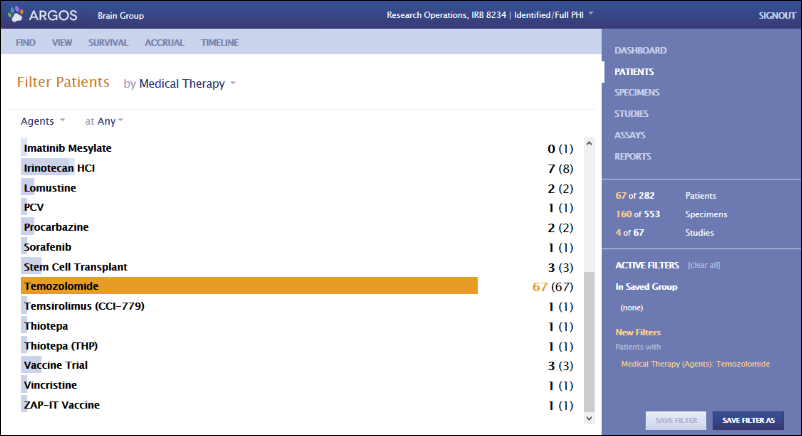
Among Medical Therapy Agents, we select Temozolomide. This filters the patient population down to those treated with this agent. The number of patients in this group is shown in orange on the right information pane, next to the total population available within the portal repository. The applied filter is listed in the lower right corner, along with any previously applied filters.
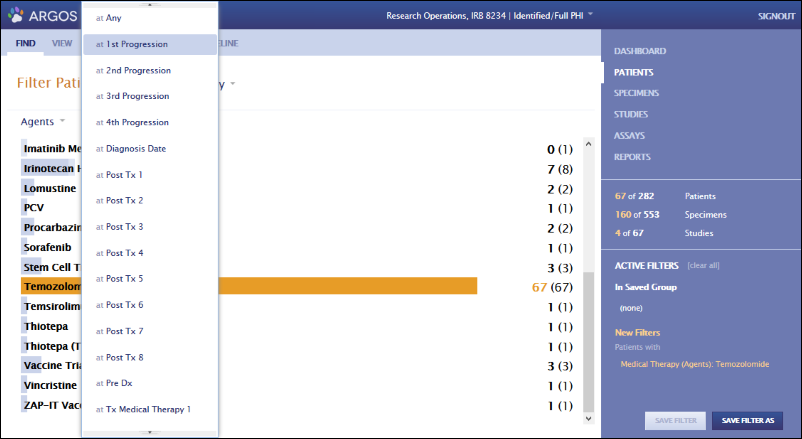
If we wish, we could further filter the available population by a sub-characteristic, such as the timing of delivery of the medical agent (e.g., delivery at first progression).
Survival
After filtering the available population down to a group of interest, we can explore trends for this group using a variety of visualizations.
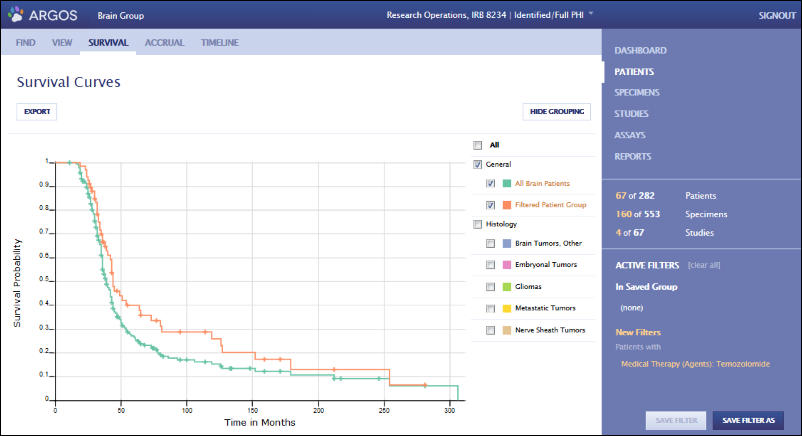
The Survival view allows us to compare survival trends for the selected group (= those treated with Temozolomide) with all patients whose data is available within the portal.
Accrual
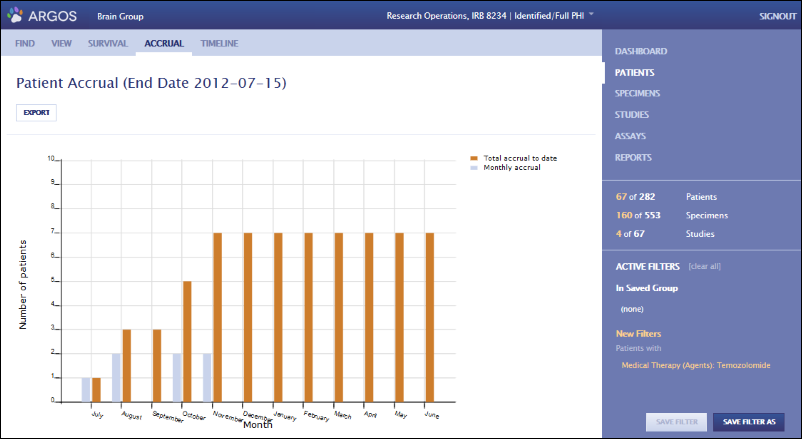
The Accrual report shows how quickly patients with a particular set of characteristics are being added to the population. This report can help researchers forecast how quickly study participants will walk in the door who might could be eligible for a study that requires participants with particular histories and demographics.
Note: For those with access to the Argos demo area, the accrual report will not show results unless you modify the URL to adjust the current date to match the demo data. For example:
https://argos.labkey.com/argos/home/Brain%20Portal/app.view?_testEndDate=2012-03-15#Patients/patients/accrual
Timeline
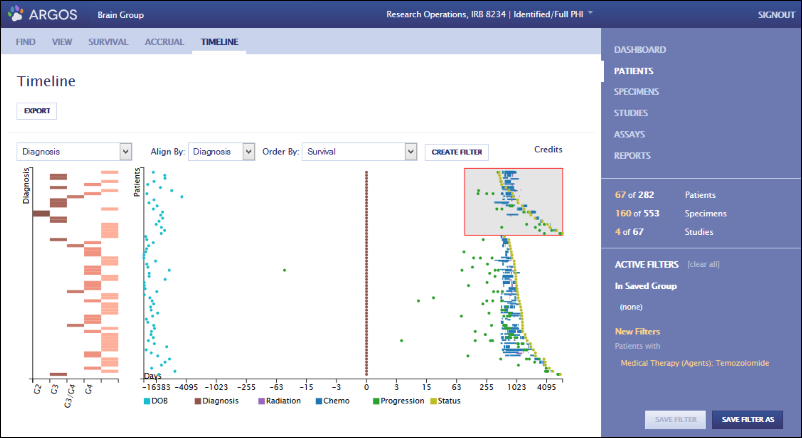
The patient event Timeline helps users visualize and align patient events, such as diagnosis, treatment phases, and outcomes, alongside additional characteristics, such as grade or age at diagnosis.
Here we have aligned patient diagnosis events, ordered patients by survival, and highlighted the surviving group by click/drag (the red box on the right).
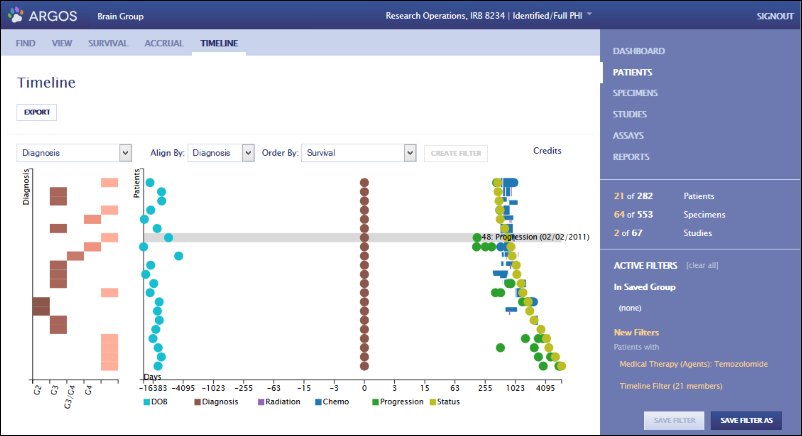
If we create a filter using the selected group, the selected population is filtered down to those treated with Temozolomide who remains alive. Hovering over a data point displays the type and date of the event it represents.
Saved filters
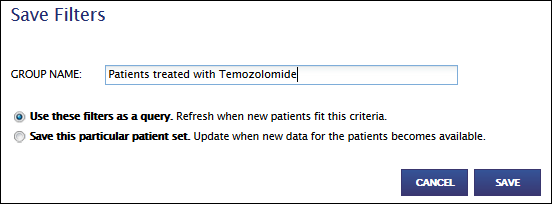
After identifying a population of interest, you may wish to revisit it later. The "Save Filter" option in the lower right of the Argos interface enables this. A saved filter can either retrieve the exact patient set available when the filter was created, or a patient set that is updated as new patients arrive that match the filter criteria.
Data grids
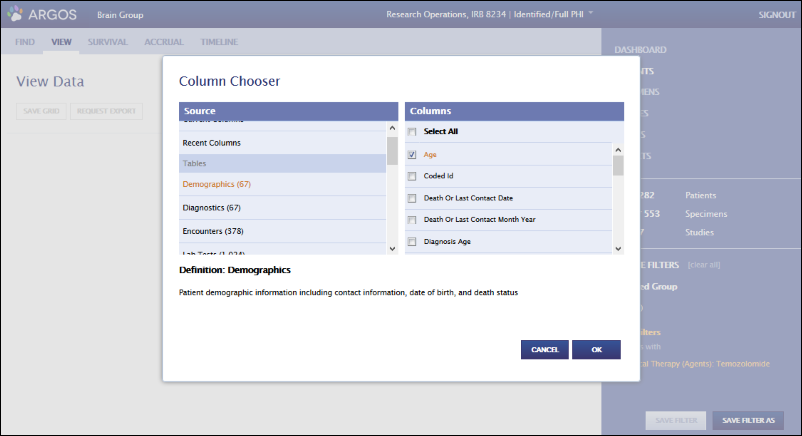
The View option helps you dig into more detailed data for a selected patient population by accessing the Column Chooser. The Column Chooser allows you to select specific columns from the Caisis tables that hold the data displayed in Argos. Tables are on the left and accompanied by the number of rows available in each; columns are on the right.
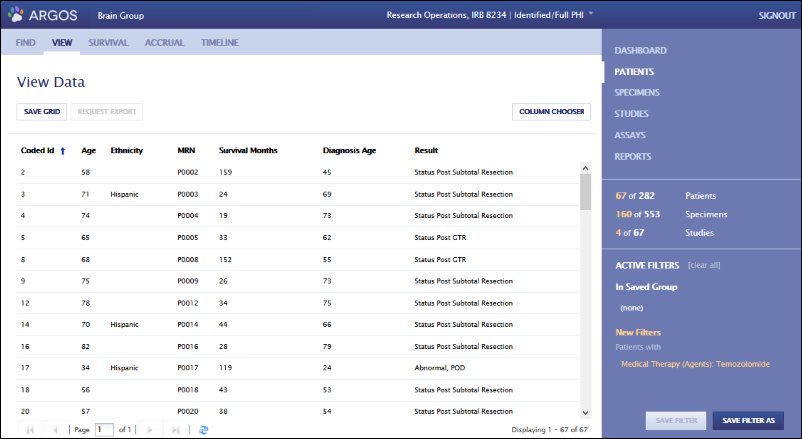
After displaying selected columns, you can sort and filter them. You can also save the grid you have created and return to it later via the Dashboard. The grid will update with new information as it becomes available.
Logging and Auditing
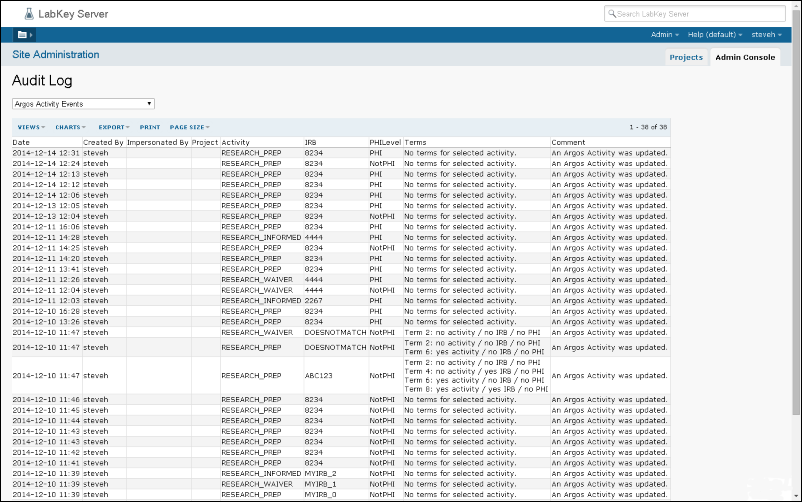
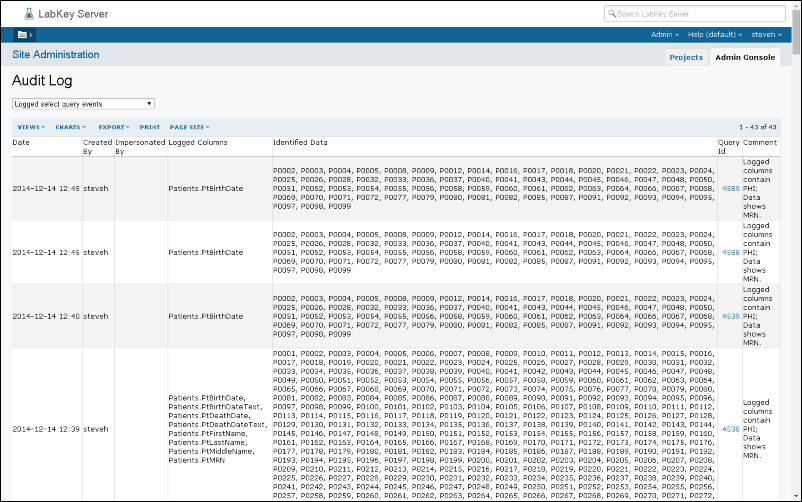
Details of user activities are logged to support auditing and regulatory compliance needs. Data access logs include information on the researcher, the date and time of data access, the PHI columns accessed, the terms of use accepted to access the data, identifiers of the patients viewed, and the query used to access the data, among other things.
Administrators can extract any information needed from these logs using the rich reporting and querying tools built into LabKey Server. For example, administrators can easily determine which researchers viewed a particular patient’s data (in the case of an information request), or which patients were viewed by a particular researcher (in case of concern about data use by an individual).


 After we select this category, histograms show the number of patients with each characteristic.
 Among Medical Therapy Agents, we select Temozolomide. This filters the patient population down to those treated with this agent. The number of patients in this group is shown in orange on the right information pane, next to the total population available within the portal repository. The applied filter is listed in the lower right corner, along with any previously applied filters.
 If we wish, we could further filter the available population by a sub-characteristic, such as the timing of delivery of the medical agent (e.g., delivery at first progression).

 Note: For those with access to the Argos demo area, the accrual report will not show results unless you modify the URL to adjust the current date to match the demo data. For example: https://argos.labkey.com/argos/home/Brain%20Portal/app.view?_testEndDate=2012-03-15#Patients/patients/accrual
 If we create a filter using the selected group, the selected population is filtered down to those treated with Temozolomide who remains alive. Hovering over a data point displays the type and date of the event it represents.

 After displaying selected columns, you can sort and filter them. You can also save the grid you have created and return to it later via the Dashboard. The grid will update with new information as it becomes available.

