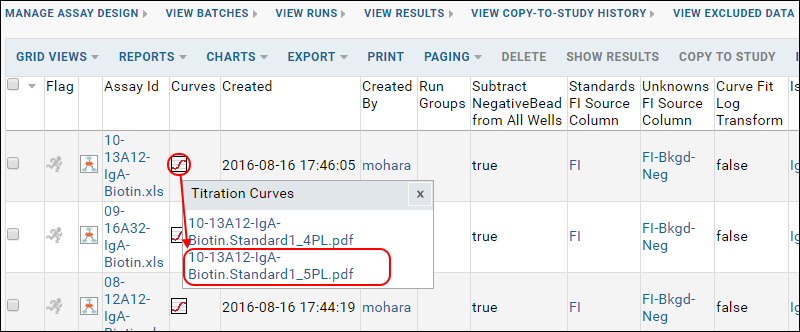
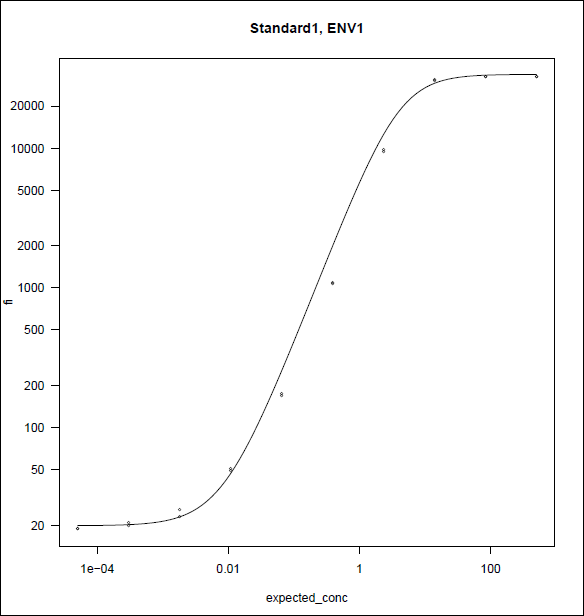
This step introduces some of the values calculated by the server and transform script for each standard's titration, including the 4- and 5-parameter logistic curve fits. For each run, the script outputs a PDF that includes plots for curve fits for each analtye. Each plot shows the dose response curve for fluorescence intensity with increasing concentration or reduced dilution. These plots can be useful for examining how well the curves fit the data.
For additional background and details about these and other calculations that are performed, see
Luminex Calculations.
View Curve Fits
As an example, here we view one of the 5pl curves generated for the tenth run.
- Go to the Assay List and click Luminex Assay 200.
- Click the curve icon in the Curves column for the tenth run (Assay ID 10-13A12-IgA-Biotin.xls).
- Select 10-13A12-IgA-Biotin.Standard1_5PL.pdf.

- Open the file. Depending on your browser settings, it may open directly or download for you to click to open.
- You will see a series of curves like the one below:

- You can open this PDF to see a full set of example curves.
Note: The PDF files for these curves for each run were deposited by the LabKey Luminex transform script in the
Runs - Assay 200 folder when the script ran during run import.
View Calculated Values
Some calculated values are stored in the results grid with other Luminex data, others are part of the titration qc reports for standards and other titrations. For more information about the calculations, see
Luminex Calculations.
View Calculated Values in Titration QC Reports
For the same tenth run, view calculated values including estimated concentration at 50%, or EC50.
- Return to the Assay Dashboard.
- Click Luminex Assay 200.
- In the runs list, click on the Assay ID "10-13A12-IgA-Biotin.xls."
- Click View QC Report > view titration qc report.
- The report shows one row for each analyte in this run. You can see a similar one in the interactive example.
- Scroll to the right to see columns calculated by the script:
- Four Parameter Curve Fit EC50
- Five Parameter Curve Fit EC50
- High MFI
- Trapezoidal Curve Fit AUC
Since you selected the report for a single run, you will see 6 rows for just that run. To see these values for all runs, first click
View Runs, then select
View QC Report > view titration qc report for a report of values from all "Luminex Assay 200" runs.
View Calculated Values in Results Grid
- Return to the Assay Dashboard.
- Click Luminex Assay 200.
- In the runs list, click on the Assay ID titled 10-13A12-IgA-Biotin.xls
- In the Results view, scroll to the right to see columns calculated by the script:
- FI-Bkgd-Neg
- Standard for Rumi Calc
- Est Log Conc - Rumi 5 PL
- Est Conc - Rumi 5 PL
- SE - Rumi 5 PL
- Est Log Conc - Rumi 4 PL
- Est Conc - Rumi 4 PL
- SE - Rumi 4 PL
- Slope Param 4 PL
- Lower Param 4 PL
- Upper Param 4 PL
- Inflection Param 4 PL
- Slope Param 5 PL
- Lower Param 5 PL
- Upper Param 5 PL
- Inflection Param 5 PL
- Asymmetry Param 5 PL
You could also view these values in the
interactive example.
