The FluoroSpot assay is a variant of the ELISpot assays, but in place of enzymes, FluoroSpot uses fluorophores to signal cell secretion. The use of variously colored fluorophores in a single well lets a researcher detect several secreted analytes simultaneously.
The FluoroSpot assay type assumes that your data has been output as multi-sheet Excel files from an AID MultiSpot reader.
FluoroSpot Assay Set Up
The follow instructions explain how to create a new FluoroSpot plate template and assay design (based on the FluoroSpot assay type).
- Select Admin > Manage Assays.
- Click Configure Plate Templates.
- Click New 96 Well (8x12) ELISpot Default Template
- Name and configure the plate as fits your experiment. When finished, click Save and Close.
- Select Admin > Manage Assays.
- Click New Assay Design.
- Select ELISpot and the current folder as the Assay Location, then click Next.
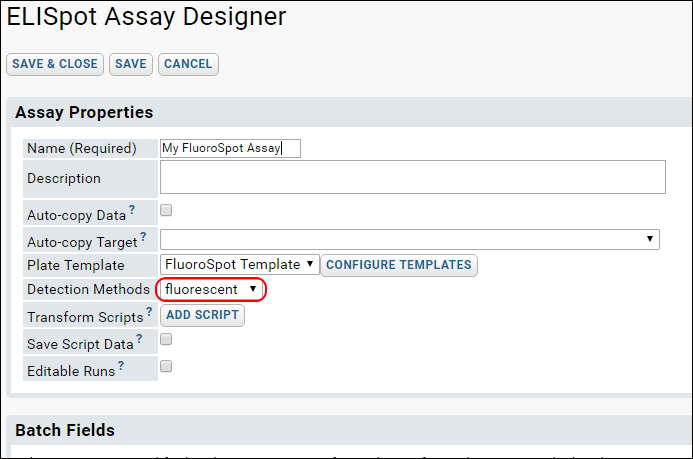
- In the Assay Properties section, on the Plate Template dropdown, select a plate template. (If you haven't yet configured a template, you can click Configure Templates, though this will end the Assay Design wizard -- you will need to restart the wizard after you complete the template.)
- In the Assay Properties section, on the Detection Methods dropdown, select 'fluorescent'.

- Set the Batch, Run, Sample, Antigen, and Analyte fields as appropriate to your experiment.
- Click Save and Close.
Importing Data to the FluoroSpot Design
To import data into the assay design, you can use the "Import Data" button, as shown below; or, as an alternative, you can use the Files web part (for details, see
Import Data from Files). Note that data import for the FluoroSpot assay is similar to data import for the ELISpot assay -- to compare these processes see:
ELISpot Assay Tutorial.
- If you wish to use sample data to become familiar with the data import process, download the following sample files:
- On the Assay List, select your FluoroSpot assay design.
- Click Import Data
- Enter any Batch Properties for your experiment.
- If you plan to integrate the assay data into a study, specify how the data maps to other data you have collected. For details see Participant/Visit Resolver. The actual data entry for participants, visits, and/or specimens takes place in the next step.
- Click Next.
- Enter any Run Properties for your experiment, for example, specify the lab which performed the assay runs.
- Select the Plate Reader - note that this field is required. If using our example files, select AID.
- Select Choose File and select the spreadsheet of data to be imported.
- Enter the ParticipantId, VisitId, or SpecimenId, depending on how this information is encoded.
- Click Next.
- Enter the Antigen Properties for your experiment, including the Antigen name(s), id(s) and the number of cells per well.
- On the Analyte Properties page, enter the cytokine names used in the experiment.
- Click Save and Finish, or Save and Import Another Run if you have more spreadsheets to enter.
FluoroSpot Statistics and Plate Summary
- Once data import is complete, you will be taken to the "Runs" view of your data.
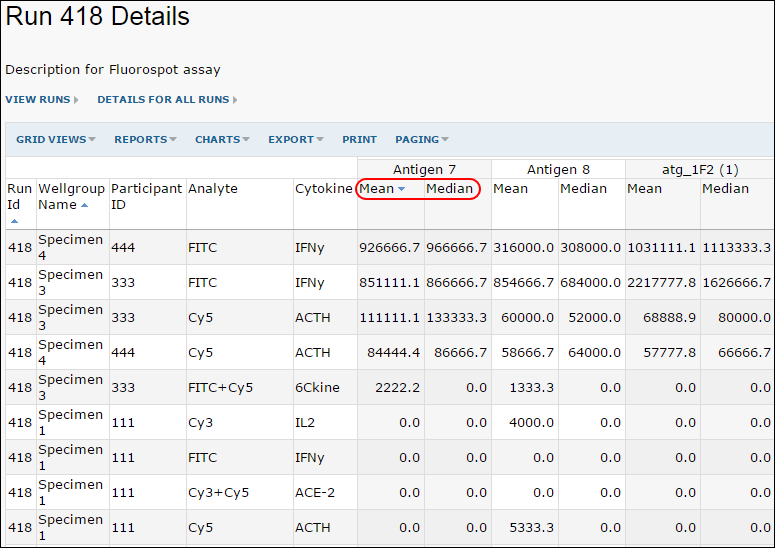
- Click Run Details to view statistics (mean and median) grouped by antigen.

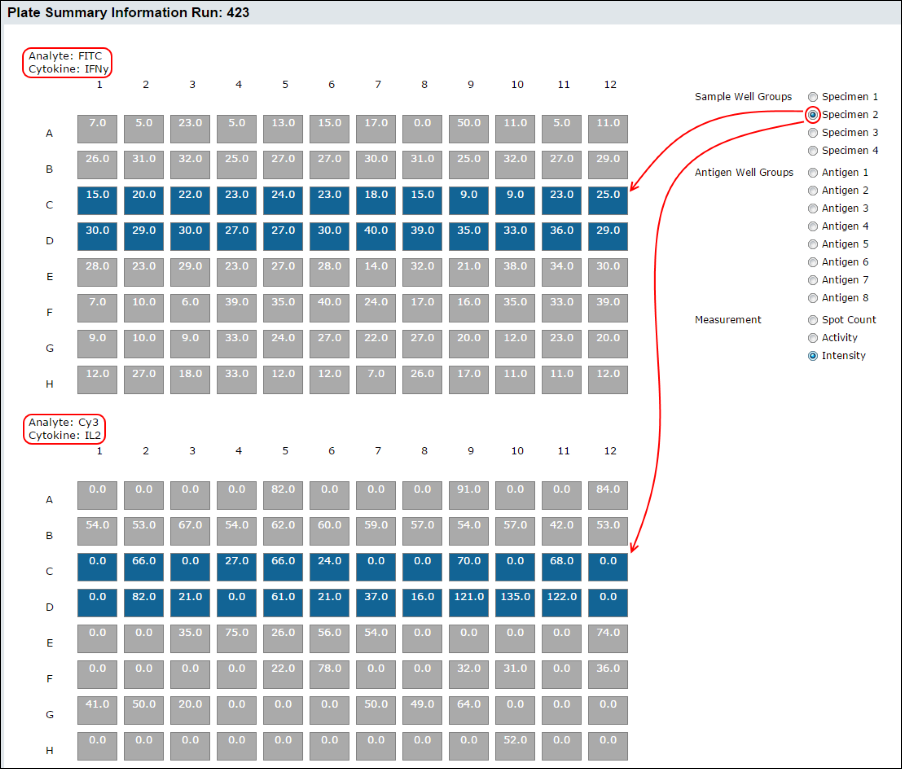
- The Run Details view also displays plate summary information for each analyte. Select the sample and antigen to highlight the applicable wells. Hover over a well to see more details.


