Tabular data, presented as familiar rows and columns, is the most common representation of biomedical research data. Spreadsheet programs like Excel have long been used by scientists because they are so flexible and useful for storing raw tabular data sets, encapsulating calculations, and presenting summary data.
Spreadsheets don't scale well, however. Research data sets are constantly growing larger, more numerous, and more diverse, largely driven by advances in lab instruments that take measurements at the cellular and molecular level. Scientists have found that spreadsheets can no longer serve as the primary tool for managing this data. Data management and integration have become increasingly challenging, and inadequate tools undermine the the consistency and reproducibility of research findings.
Relational databases, such as PostgreSQL and Microsoft SQL Server, are server applications that are very efficient at storing and retrieving large volumes of tabular data. They support data requests from client users in the form of Structured Query Language (SQL), and exchange tabular data with those clients in response. By themselves, relational databases are too inaccessible and hard to use to become the primary data management tool for most scientists.
LabKey Server is a web-based application that wraps a relational database with tools and capabilities that make it much more useful and flexible for research data. These tools include data importers and exporters, interactive grids to browse tabular data, file repositories, graphical analysis features, and integration capabilities, as well as customization and security mechanisms that suit complex, multi-site research networks. At its core, LabKey Server works by deconstructing a request coming in from a web user, checking permissions and reconstructing the request as appropriate to the underlying relational database, then embellishing the tabular data response with additional information and exploration features before sending it back the user's browser.
For example, an interactive, customizable
data grid might look like this:

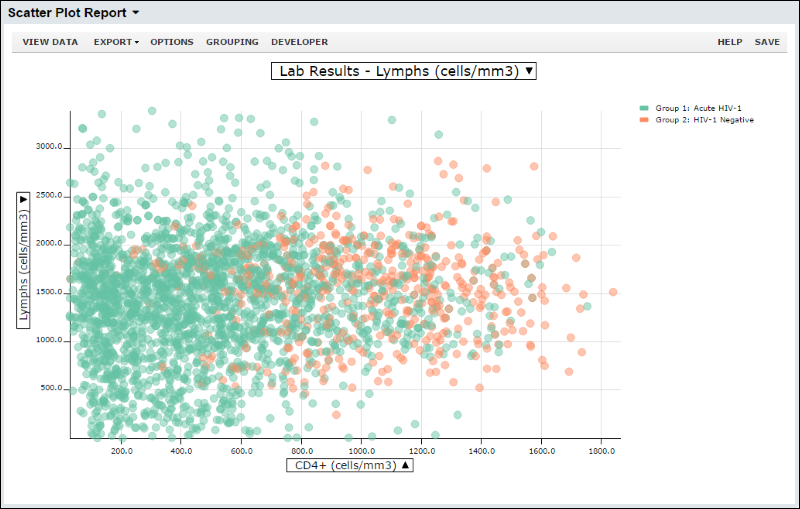
A
scatter plot of the same data:

Topics