This tutorial shows you how to:
Set up an ELISA Plate Template and Assay Design
First set up an
assay folder as a workspace.
- Navigate to the Home project.
- Create a new folder to work in.
- Name: "ELISA Experiment".
- Folder Type: Assay.
- Click Next.
- On the Users/Permissions page, make no changes and click Finish.
Next configure a
plate template that corresponds to the plate of your ELISA experiment.
- In the Assay List web part, click Manage Assays.
- Click Configure Plate Templates.
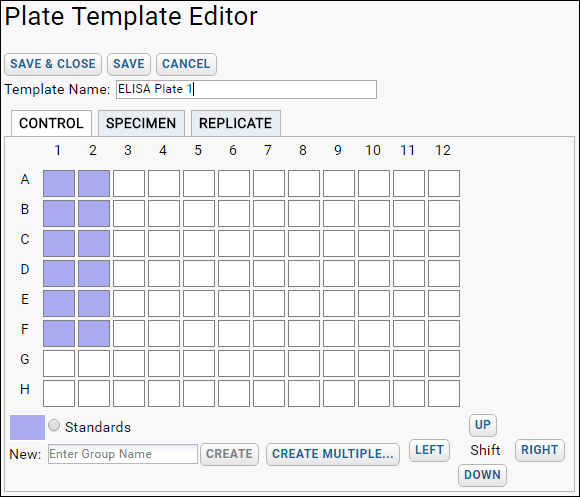
- Select "New 96 well (8X12) ELISA default template".
- Enter a Template Name, for example, "ELISA Plate 1".
- Review the shape of the template, clicking the Control, Specimen, and Replicate tabs to see the well groupings. Notice that you could edit the template to match alternate well groupings if needed; instructions can be found in Edit Plate Templates. For the purposes of this tutorial, simply save the default.

- When finished, click Save & Close.
Now you can create the
assay design using that template:
- Click the Assay Dashboard tab.
- Click New Assay Design
- Select ELISA and choose the current folder from the Assay Location dropdown, then click Next.
- Provide a Name, for example, "HIV-ENV1 - ELISA Assay".
- Select a Plate Template: "ELISA Plate 1" (it may already be selected by default).
- Scroll down the page and review the data fields. You could add or edit fields, but for this tutorial, leave the default design unchanged.
- Click Save & Close.
Import ELISA Experiment Data
- Download sample data:
- Click the Assay Dashboard tab.
- In the Assay List, click to select your assay design HIV-ENV1 - ELISA Assay.
- Click Import Data.
- Accept the default batch properties by clicking Next.
- In the Run Data field, click Browse or Choose File and select one of the sample data files you just downloaded. Make no other changes on this page, then click Next.
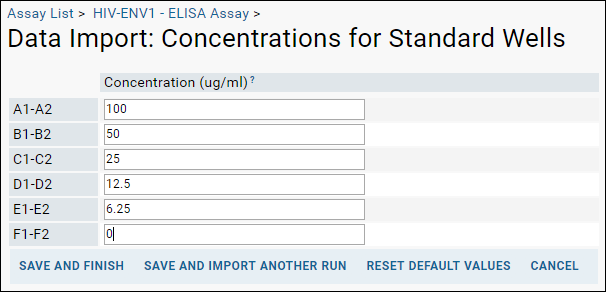
- On the next page, enter Concentrations for Standard Wells as shown here:

- Click Save and Import Another Run. Repeat the import process for the other two files, clicking Save and Finish after the last one.
Visualize the Data
When you are finished importing, you'll see the runs grid showing the files you just uploaded. Since you did not specify any other Assay IDs, the filenames are used. Browse the data and available visualizations:
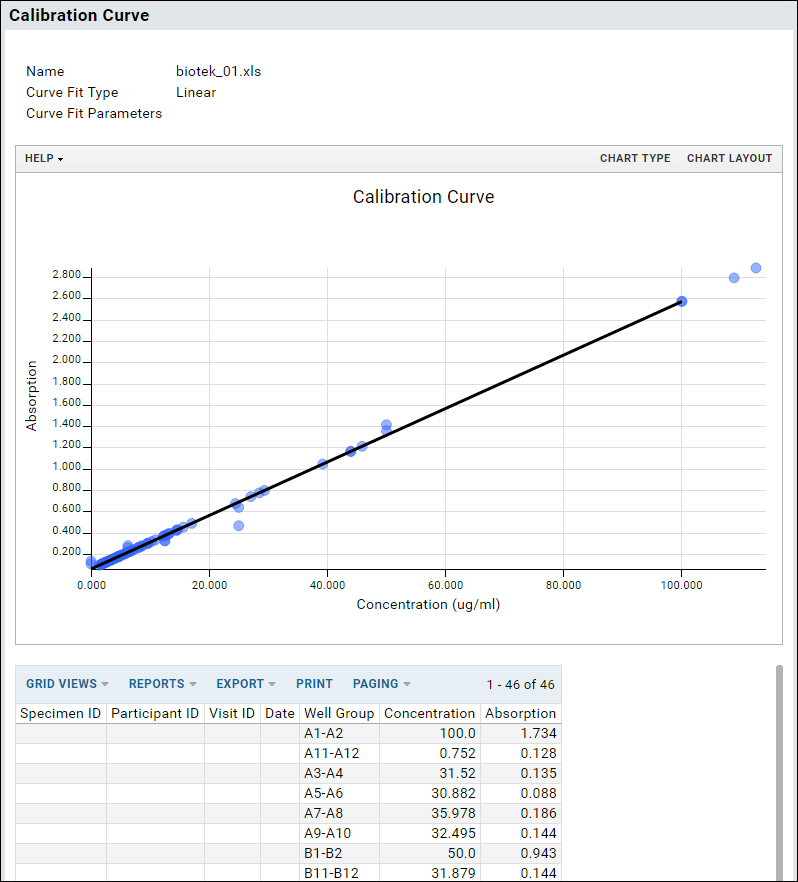
- In the row for Assay Id "biotek_01.xls", click Details.
- You will see a visualization and tabular grid of the data. The server automatically generates a calibration curve for the control values.

Related Topics