Anatomy of a Data Grid View
The following image shows a typical data grid view.

- grid view title: Shows the kind of data structure (in this case a "Dataset") and the title ("Physical Exam, All Visits").
- QC state filter: Shows whether the data shown is filtered by quality control state.
- button bar: Shows the different tools that can be applied to your data.
- grid view indicator: Shows the current view/perspective on the data. Views are created to show or highlight a particular aspect of the data. Each data grid has a default view that displays all of its rows and columns.
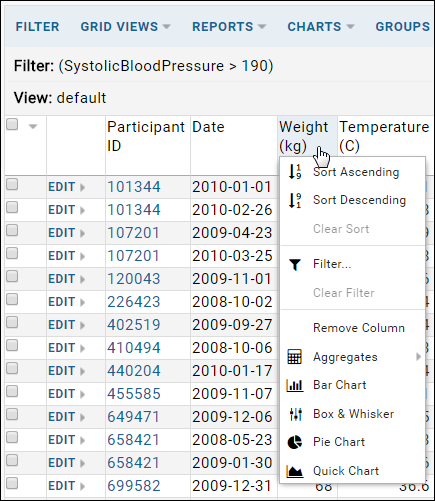
- column headers: Click a column header for a list of actions:

- data records: Displays the data as a 2-dimensional table of rows and columns.
See an
interactive example of the grid shown above.
Button Bar
The button bar tools available may vary with different types of data grid. Study datasets can provide additional functionality, such as filtering by cohort, that are not available to lists. Assays and proteomics data grids provide many additional features.
Common buttons and menus include:
- Grid Views - pull-down menu for creating, selecting, and managing various grid views of this data.
- Reports - pull-down menu for creating and selecting saved reports.
- Charts - pull-down menu for creating and selecting charts based on the data grid.
- Insert - insert a new single row, or bulk import data.
- Delete - delete one or more rows selected by checkbox.
- Export - export the data grid as a spreadsheet, text, or in various scripting formats.
- Paging - change how many rows are shown per page, or choose options to show selected or unselected rows across pages.
- Design/Manage - with appropriate permissions, change the structure and behavior of the given list or dataset.
Customize Grid Views
- You can create grid views that show a subset of the columns or that combine columns from multiple data grids.
- You can also create customized reports that present the data as a chart or graph.
Other Display Tools
Examples
The following links show different views of a single data grid:
