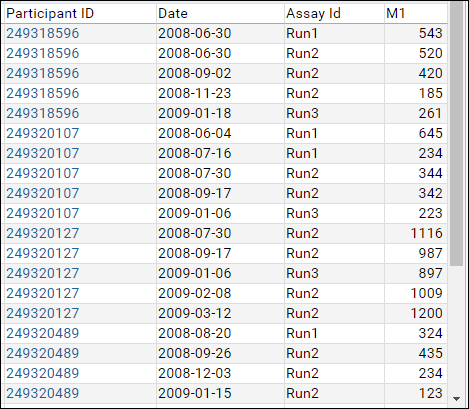
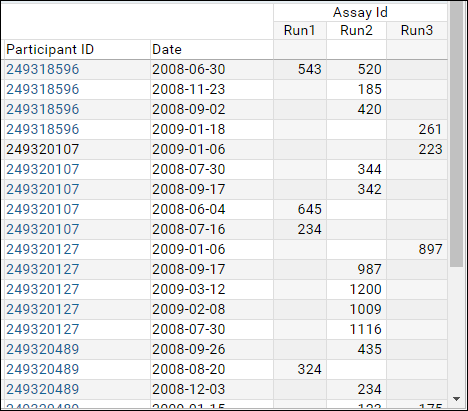
A pivot query helps you summarize and revisualize data in a table. Data can be grouped or aggregated to help you focus on a particular aspect of your data. For example a pivot table can help you see how many data points of a particular kind are present, or it can represent your data by aggregating it into different categories.
Create a new SQL query and edit its source.
- Select Admin > Developer Links > Schema Browser.
- Select a schema. In this example we chose "study.GenericAssay"
- Click Create New Query.
- Name it and confirm the correct schema is selected.
- Click Create and Edit Source.
Syntax for PIVOT query
A PIVOT query is essentially a SELECT specifying which columns you want and how to PIVOT and GROUP them. To write a pivot query, follow these steps. Our walkthrough example uses the fictional
GenericAssay data in the interactive example study.
(1) Start with a base SELECT query.
SELECT ParticipantID, date, "Run.Name", M1
FROM GenericAssay 
(2) Identify the data cells you want to pivot and how. In this example, we focus on the values in the
Assay Id column (the run name), to separate M1 values for each.
(3) Select an aggregating function to handle any non-unique data, even if you do not expect to need it. MAX, MIN, AVG, and SUM are possibilities. If you had only one row for each participant/date/run combination, all would produce the same result, but here we have several sets with multiple values. In this example, we want to display only the maximum value for any given PTID/date/run combination. When aggregating, we can also give the column a new name, here MaxM1.
(4) Identify columns which remain the same to determine the GROUP BY clause.
SELECT ParticipantID, date, "Run.Name",
Max(M1) AS MaxM1
FROM GenericAssay
GROUP BY ParticipantID, date, "Run.Name"(5) Finally, pivot the cells.
SELECT ParticipantID, date, "Run.Name",
Max(M1) AS MaxM1
FROM GenericAssay
GROUP BY ParticipantID, date, "Run.Name"
PIVOT MaxM1 BY "Run.Name"
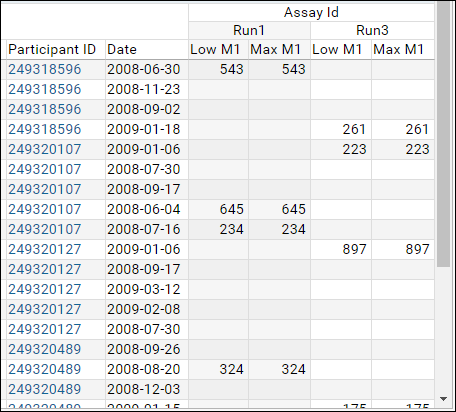
(6) You can focus on particular values using
IN. In our example, perhaps we want to see only two runs:
SELECT ParticipantID, date, "Run.Name",
Max(M1) AS MaxM1
FROM GenericAssay
GROUP BY ParticipantID, date, "Run.Name"
PIVOT MaxM1 BY "Run.Name"
IN ('Run1', 'Run3')Note that pivot column names are case-sensitive. You may need to use lower() or upper() in your query to work around this issue if you have two values who differ only by letter case.
Grouped Headers
You can add additional aggregators and present two pivoted columns, here we show both an average and a maximum M1 for each participant/date/run combination.
SELECT ParticipantID, date, "Run.Name",
Min(M1) AS LowM1,
Max(M1) AS MaxM1
FROM GenericAssay
GROUP BY ParticipantID, date, "Run.Name"
PIVOT
LowM1, MaxM1 BY "Run.Name" IN ('Run1', 'Run3')

Summary Columns
In a pivot query there are three types of columns:
- "Group By" columns
- "Pivoted" columns
- "Summary" columns
For example:
SELECT
-- Group By columns
AssignedTo,
Type,

-- Summary columns. Turned into a SUM over the COUNT(*)
COUNT(*) AS Total,

-- Pivoted columns
SUM(CASE WHEN Status = 'open' THEN 1 ELSE 0 END) AS "Open",
SUM(CASE WHEN Status = 'resolved' THEN 1 ELSE 0 END) AS Resolved

FROM issues.Issues
WHERE Status != 'closed'
GROUP BY AssignedTo, Type
PIVOT "Open", Resolved BY Type IN ('Defect', 'Performance', 'Todo')
The summary columns have an aggregate but aren't included in the group-by or pivoted list.
When generating the pivot, all columns not included in the group-by clause need to be aggregated. The summary columns are aggregated as follows:
- a COUNT or SUM aggregate summary column is wrapped with SUM
- a MIN or MAX is wrapped with a MIN or MAX
Examples
Another practical application of a pivot query is to display a list of how many issues of each priority are open for each area.
Example 1
SELECT Issues.Area,
Issues.Priority,
Count(Issues.IssueId) AS CountOfIssues
FROM Issues
GROUP BY Issues.Area, Issues.Priority
PIVOT CountOfIssues BY Priority IN (1,2,3,4)
Example 2
SELECT
-- Group By columns
AssignedTo,
Type,

-- Summary columns. Turned into a SUM over the COUNT(*)
COUNT(*) AS Total,

-- Pivoted columns
SUM(CASE WHEN Status = 'open' THEN 1 ELSE 0 END) AS "Open",
SUM(CASE WHEN Status = 'resolved' THEN 1 ELSE 0 END) AS Resolved

FROM issues.Issues
WHERE Status != 'closed'
GROUP BY AssignedTo, Type
PIVOT "Open", Resolved BY Type IN ('Defect', 'Performance', 'Todo')
Example 3
SELECT ParticipantId, date, Analyte,
  Count(Analyte) AS NumberOfValues,
  AVG(FI) AS AverageFI,
  MAX(FI) AS MaxFI
FROM "Luminex Assay 100"
GROUP BY ParticipantID, date, Analyte
PIVOT AverageFI, MaxFI BY Analyte
Example 4
SELECT SupportTickets.Client AS Client,
SupportTickets.Status AS Status,
COUNT(CASE WHEN SupportTickets.Priority = 1 THEN SupportTickets.Status END) AS Pri1,
COUNT(CASE WHEN SupportTickets.Priority = 2 THEN SupportTickets.Status END) AS Pri2,
COUNT(CASE WHEN SupportTickets.Priority = 3 THEN SupportTickets.Status END) AS Pri3,
COUNT(CASE WHEN SupportTickets.Priority = 4 THEN SupportTickets.Status END) AS Pri4,
FROM SupportTickets
WHERE SupportTickets.Created >= (curdate() - 7)
GROUP BY SupportTickets.Client, SupportTickets.Status
PIVOT Pri1, Pri2, Pri3, Pri4 BY Status