The
reports directory holds different kinds of reports and associated configuration files which determine how the reports are surfaced in the user interface.
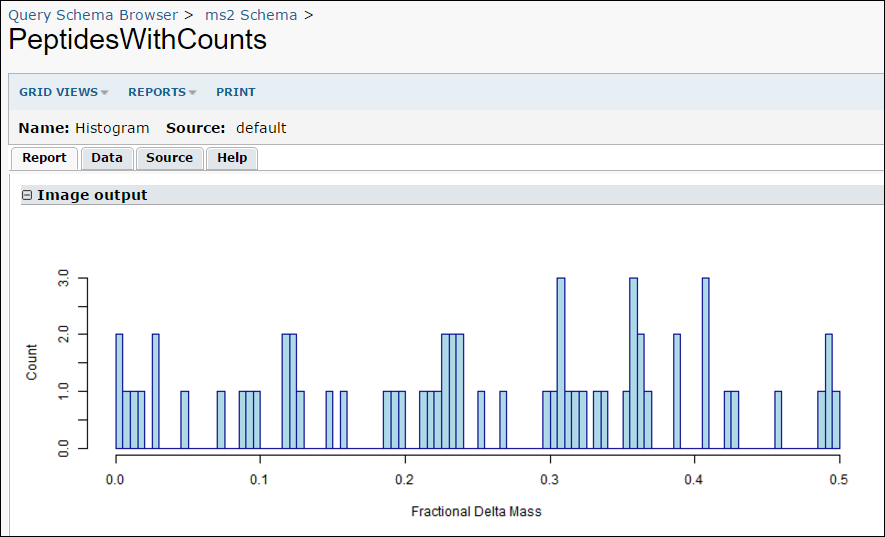
Below we'll make an R report script that is associated with the PeptidesWithCounts query (created in the previous step).
- In the reports/ directory, create the following subdirectories: schemas/ms2/PeptidesWithCounts, and a file named "Histogram.r", as shown below:
reportDemo
│ module.properties
└───resources
├───queries
│ └───ms2
│ │ PeptideCounts.sql
│ │ PeptidesWithCounts.sql
│ │
│ └───Peptides
│ High Prob Matches.qview.xml
│
├───reports
│ └───
schemas
│ └───
ms2
│ └───
PeptidesWithCounts
│
Histogram.r
│
└───views
- Open the Histogram.r file, enter the following script, and save the file. (Note that .r files may have spaces in their names.)
png(
    filename="${imgout:labkeyl_png}",
    width=800,
    height=300)

hist(
    labkey.data$fractionaldeltamass,
    breaks=100,
    xlab="Fractional Delta Mass",
    ylab="Count",
    main=NULL,
    col = "light blue",
    border = "dark blue")

dev.off()
Report Metadata
Optionally, you can add associated metadata about the report. See
Modules: Report Metadata.
Test your SQL Query and R Report
- Go to the Query module's home page (Admin -> Go to Module -> Query). Note that the home page of the Query module is the Query Browser.
- Open the ms2 node, and see your two new queries in the user-defined queries section.
- Click on PeptidesWithCounts and then View Data to run the query and view the results.
- While viewing the results, you can run your R report by selecting Views -> Histogram.

