A
cohort is a group of participants who share particular demographic or study characteristics (e.g., all the participants of one gender, or all those with a particular HIV status).
Once an administrator has
set up your Study to include cohorts, you can filter and display participants by cohort.
Example In the
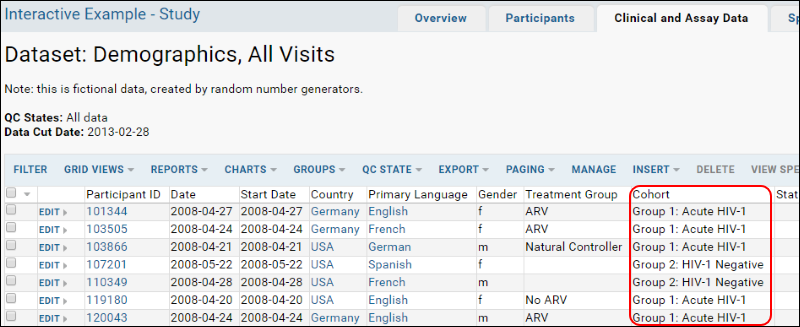
interactive example, the "Demographics" dataset has been used to assign participants to two cohorts that stay the same throughout the study. The following screenshot displays this dataset and the column used to sort participants into "Group 1: Acute HIV-1" or "Group 2: HIV-1 Negative."

Filter Data by Cohort
The
Cohorts option on the
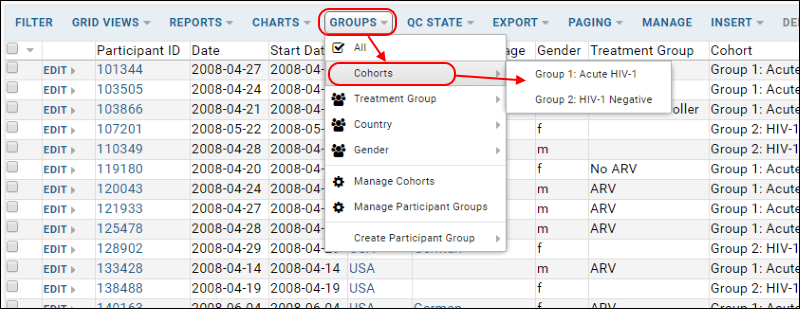
Groups drop-down menu above each dataset lets you display only those participants who belong to a desired cohort:

The Physical Exam dataset in the interactive example can be filtered by cohort in this way. Click the following links to see:
Notice that while there is no visible column for cohort in this example, the results are still limited to those participants assigned to each cohort.
View Individual Participants by Cohort
Time-invariant cohorts. You can display per-participant details exclusively for participants within a particular cohort. Steps:
- Display a dataset of interest.
- Filter it by the desired cohort using the Groups > Cohorts drop-down menu.
- Click a participantID.
- You now see a per-participant details view for this member of the cohort. Click "Next Participant" or "Previous Participant" to step through participants who are included in this cohort.
The information in the interactive example study can display per-participant views by cohort in this way. Click the following links to see:
Time-varying cohorts. If you administrator has
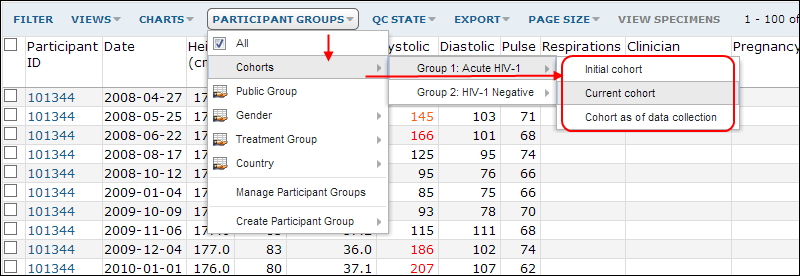
set up "Advanced" cohorts, cohorts can vary over time. If this is the case, your "Cohorts" drop-down menu will contain additional options. You will be able to filter by cohort and select one of the following:
- Initial cohort. You will see all participants that began the study in the selected cohort.
- Current cohort. You will see all participants that currently belong to the selected cohort.
- Cohort as of data collection. You will see participants who belonged to the selected cohort at the time when the data or a specimen was obtained.

Customize Grid to Add a Cohort Column
Cohort membership can be displayed as an extra column in a datagrid by creating a custom grid.
- Display the dataset of interest.
- Select Grid Views > Customize Grid.
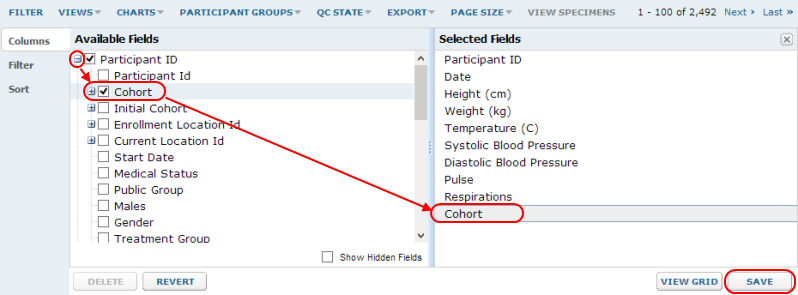
- You will now see the Custom Grid designer, as shown here:

- On the left-hand side of the designer, expand the ParticipantID node by clicking on the "+" sign next to it.
- Place a checkmark next to Cohort.
- In the Selected Fields panel, you can reorder the fields by dragging and dropping.
- Click Save and name your custom grid, or make it the default for the page.
- The new grid will display a Cohort column that lists the cohort assigned to each participant.
 The Physical Exam dataset in the interactive example can be filtered by cohort in this way. Click the following links to see:
