This topic provides a series of examples to illustrate some SQL features:
GROUP BY
The GROUP BY function is useful when you wish to perform a calculation on a table that contains many types of items, but keep the calculations separate for each type of item. You can use GROUP BY to perform an average such that only rows that are marked as the same type are grouped together for the average.
For example, what if you wish to determine an average for each participant in a large study dataset that spans many participants and many visits. Simply averaging a column of interest across the entire dataset would produce a mean for all participants at once, not each participant. Using GROUP BY allows you to determine a mean for each participant individually.
A Simple GROUP BY Example
The GROUP BY function can be used on the Physical Exam dataset to determine the average temperature for each participant across all of his/her visits.
To set up this query, follow the basic steps described in the
Create a SQL Query example to create a new query based on the "Physical Exam" table in the study schema. Name this new query "AverageTempPerParticipant."
If you are working with the LabKey demo study, these queries may be predefined, so you can view and edit them in place, or create new queries with different names.
Within the SQL Source editor, delete the SQL created there by default for this query and paste in the following SQL:
SELECT "Physical Exam".ParticipantID,
ROUND(AVG("Physical Exam".Temp_C), 1) AS AverageTemp,
FROM "Physical Exam"
GROUP BY "Physical Exam".ParticipantID
For each ParticipantID, this query finds all rows for that ParticipantID and calculates the average temperature for these rows, rounded up to the 10ths digit. In other words, we calculate the participant's average temperature across all visits and store that value in a new column called "AverageTemp."

See similar results in our
interactive example.
JOIN Columns from Different Tables
Use JOIN to combine columns from different tables.
The following query combines columns from the Physical Exam and Demographics tables.
SELECT "Physical Exam".ParticipantId,
"Physical Exam".Weight_kg,
"Physical Exam".Temp_C,
"Physical Exam".Pulse,
"Physical Exam".Respirations,
"Physical Exam".Pregnancy,
Demographics.Gender,
Demographics.Height
FROM "Physical Exam" INNER JOIN Demographics ON "Physical Exam".ParticipantId = Demographics.ParticipantId
JOIN a Calculated Column to Another Query
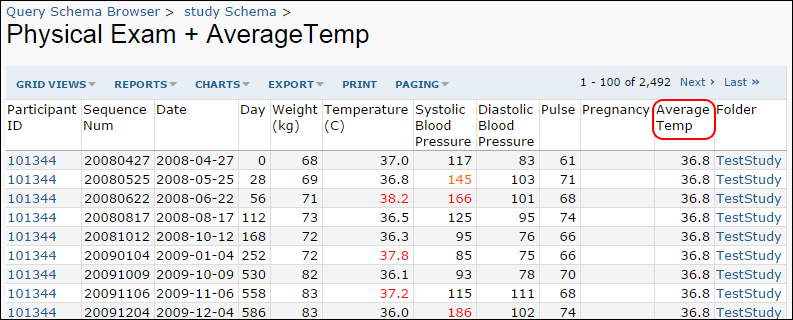
The JOIN function can be used to combine data in multiple queries. In our example, we can use JOIN to append our newly-calculated, per-participant averages to the Physical Exam dataset and create a new, combined query.
First, create a new query based on the "Physical Exam" table in the study schema. Call this query "Physical Exam + AverageTemp" and choose to edit it in the SQL Source Editor. Now add edit the SQL such that it looks as follows.
SELECT "Physical Exam".ParticipantId,
"Physical Exam".SequenceNum,
"Physical Exam".Date,
"Physical Exam".Day,
"Physical Exam".Weight_kg,
"Physical Exam".Temp_C,
"Physical Exam".SystolicBloodPressure,
"Physical Exam".DiastolicBloodPressure,
"Physical Exam".Pulse,
"Physical Exam".Pregnancy,
AverageTempPerParticipant.AverageTemp,
FROM "Physical Exam"
INNER JOIN AverageTempPerParticipant
ON "Physical Exam".ParticipantID=AverageTempPerParticipant.ParticipantID
You have added one line before the FROM clause to add the AverageTemp column from the AverageTempPerParticipant dataset. You have also added one additional line after the FROM clause to explain how data in the AverageTempPerParticipant are mapped to columns in the Physical Exam table. The ParticipantID column is used for mapping between the tables.

See similar results in the
interactive example.
Calculate a Column Using Other Calculated Columns
We next use our calculated columns as the basis for creating yet another calculated column that provides greater insight into our dataset.
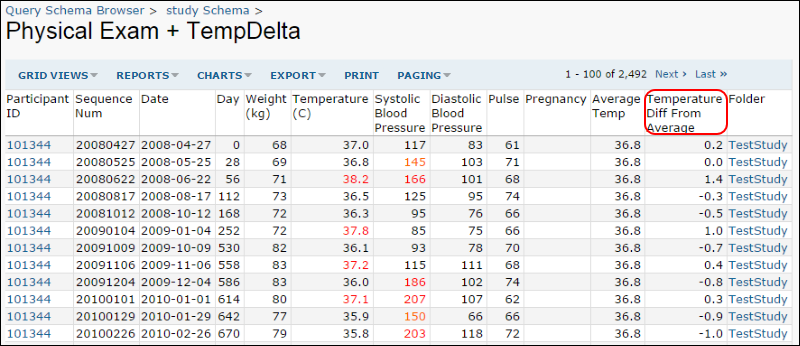
This column will be the difference between a participant's temperature at a particular visit and the average temperature for all of his/her visits. This "TempDelta" statistic will let us look at deviations from the mean and identify outlier visits for further investigation.
Steps:
- Create a new query named "Physical Exam + TempDelta" and base it on the "Physical Exam + AverageTemp" query we just created above. We create a new one here, but you could also modify the query above (with slightly different SQL) add the new column to your existing query.
- Add the following SQL expression in the Query Designer:
ROUND(("Physical Exam + AverageTemp".Temp_C-
"Physical Exam + AverageTemp".AverageTemp), 1) AS TempDelta
- Edit the Alias and Caption for the new column:
- Alias: TempDelta
- Caption: Temperature Diff From Average

See similar results in the
interactive example.
Filter Calculated Column to Make Outliers Stand Out
It can be handy to filter your results such that outlying values stand out. This is simple to do in the LabKey grid view UI using the simple filter techniques explained on the
Filter Data page.
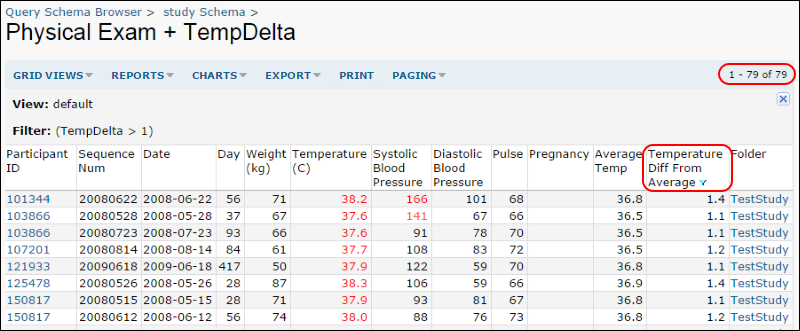
We consider the query above ("Physical Exam + TempDelta") and seek to cull out the visits were a participant's temperature was exceptionally high, possibly indicating a fever. We filter the "Temperature Diff From Average" column for all values greater than 1. Just click on the column name, select "Filter" and choose "Is Greater Than" and type "1", then click
OK.
This leaves us with a list of all visits where a participant's temperature was more than 1 degree C above the participant's mean temperature at all his/her visits. Notice the total number of filtered records is displayed above the grid.

Or see similar results in our
interactive example.