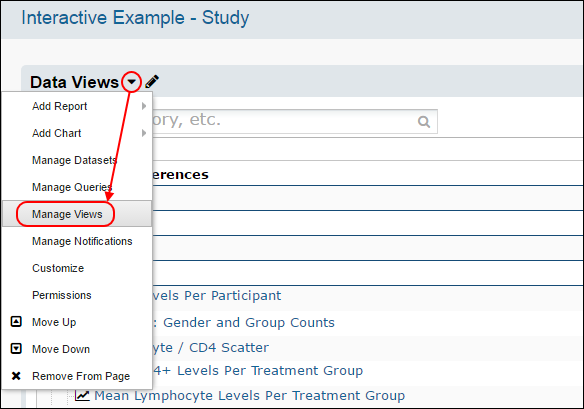
Reports, charts, datasets, and customized data grids are all ways to view data in a folder and can be displayed in a data views webpart.

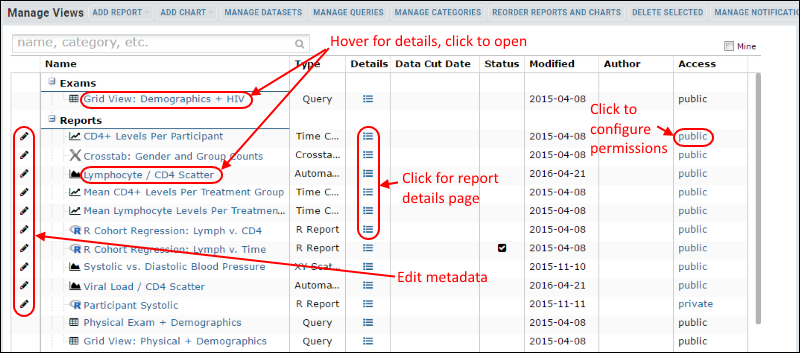
The Manage Views interface is similar to the Data Views web part, and displays a grid of all the views, queries, and reports available within a folder and allows editing of metadata as well as deletion of multiple reports in one action. The features from the pulldown menu from the data views web part are presented in a row of buttons for adding, managing, and deleting.

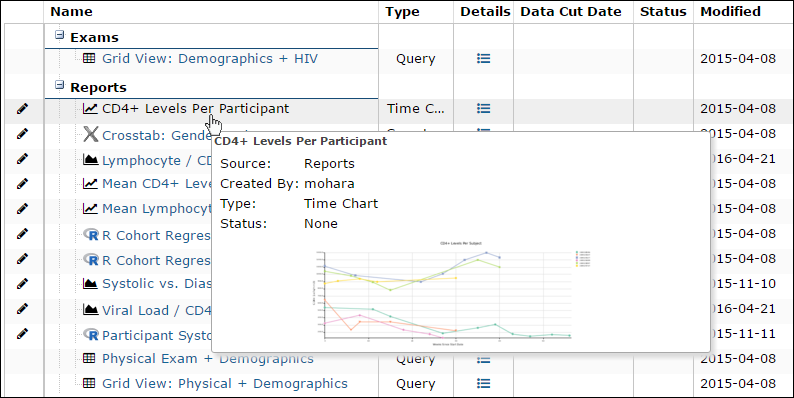
Hover over a row to view the source and type of a visualization, with a customizable thumbnail image.

Clicking the icon in the Details column for a report or chart opens the Report Details page with the full list of current metadata. The details icon for a query or named view will open the view itself.
There are two modification dates associated with each report, allowing you to differentiate between property and content changes:
Click the pencil icon next to any row to edit metadata to provide additional information about when, how, and why the view or report was created. You can also customize how the item is displayed in the data views panel.
When a visualization is created, a default thumbnail is auto-generated and a mini-icon based on the report type is associated with it. For more information about using and customizing these images, see Manage Thumbnail Images.
To rearrange the display order of reports and charts, an admin can click Reorder Reports and Charts. Users without administrator permissions will not see this button or be able to access this feature.
Click the heading "Reports and Charts" to toggle searching ascending or decending alphabetically. You can also drag and drop to arrange in any order.
When the organization is correct, click Done.
Select any row by clicking an area that is not a link. You can use Shift and Ctrl to multi-select several rows at once. Then click Delete Selected. You will be prompted to confirm the list of the views that will be deleted.
If you want to receive email notifications when the content of reports or datasets change, you can subscribe to a daily digest of changes to reports and datasets. You can receive notifications of all changes, or of changes to a given category or subcategory. These notifications are similar to email notifications for messages and file changes at the folder level, but allow finer control of which changes trigger notification. For example, if you want to allow subscription to notifications for a single report, create a singleton subcategory for it. Reports must be both visible and shared to trigger notifications.
By default, the notification includes the list of updated reports and datasets including links to each one. There is also an option to unsubscribe directly from the email digest. The template for these notifications may also be customized at the site-level, as described in Email Template Customization.