[
Video Overview: Participant Reports ] | [
Interactive Example of Participant Report ]
A
participant report provides data on one or more individual participants for selected measures. Measures from different datasets can be combined in a single report.
Create a Participant Report
- Click the Clinical and Assay Data tab.
- Open the triangle menu next to the title of the Data Views web part.
- Click Add Report > Participant Report.
- Click Choose Measures, select one or more measures, then click Select.
- When you first create a report, you will be in "edit mode" and can change your set of chosen measures, but will only see partial results. Close the edit panel by clicking the pencil icon at the top of the report to see more results; you may reopen it at any time to further edit or save the report.
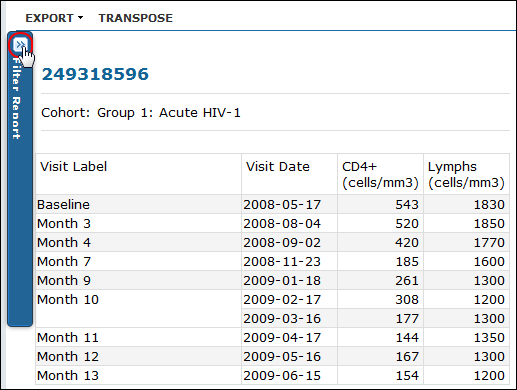
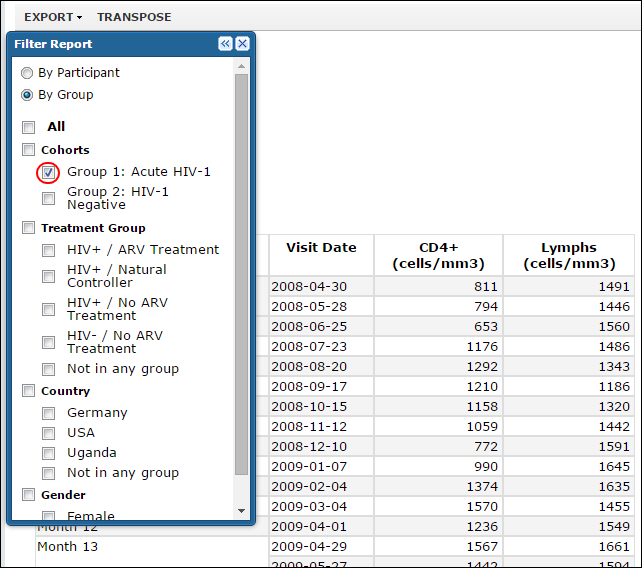
- Clicking the Filter Report chevron to use the filter panel to refine which participants appear in the report.

- Select desired filters. You may hide the filter panel with the chevron, or if you click the X to close it entirely, a Filter Report link will appear on the report menu bar.

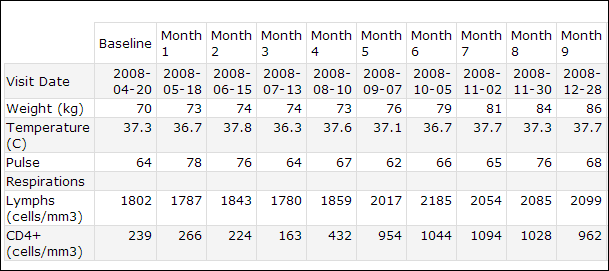
- Click the Transpose button to flip the columns and rows in the generated tables, so that columns are displayed as rows and vice versa, as shown below.

- Name and save the report (to access naming and save options, you may need to reopen edit mode by clicking the pencil icon at the top of the report).
- Your new report will appear in the Data Views.
Add the Participant Report as a Web Part
- Select Report from the <Select Web Part>, select Report.
- Name the web part, and select the participant report you created above.
- Click Submit.
Export to Excel File
Related Topics

