This topic shows you how to join protein expression data with gene and protein annotations, in order to create integrated views and visualizations on the joined data. Sample annotation and expression matrix data is provided to help walk you through the process.
Set Up an MS2 Folder
An MS2 folder makes the protein annotation data available to be linked with the protein expression data. You can create a new folder, or change an existing folder to type "MS2".
- To create a new folder:
- Navigate to the parent location.
- Select Admin > Folder > Management and click Create Subfolder.
- Give the folder a Name and for Folder Type select MS2 and click Next.
- Complete the wizard by clicking Finish.
- To change an existing folder:
- Navigate to it and select Admin > Folder > Management.
- Select the Folder Type tab
- Select MS2 and click Update Folder.
Download Sample Files
- Download the following sample files:
Import Annotation Data
Imported annotation data is parsed into a more readily useable format, i.e. into various tables in the 'proteins' schema. Once you've imported the annotation data below, you can see resulting data tables by going to
Admin > Developer Links > Schema Browser and selecting the
proteins schema in the lefthand pane. Select a table, such as
Annotations or
GOCellularLocation, and click
View Data.
Import FASTA formatted annotations:
- Go to Admin > Site > Admin Console. Under Management click Protein Databases.
- Under Protein Annotations Loaded click Import Data.
- Enter the Full file path to rat.fasta, for Type select "fasta".
- Either enter the default organism, or check the box to allow the server to try to guess.
- Click Load Annotations.
Import UniProt XML formatted annotations:
- Go to Admin > Site > Admin Console. Under Management click Protein Databases.
- Under Protein Annotations Loaded click Import Data.
- Enter the Full file path to the UniProt XML file, for Type select "uniprot".
- Click Load Annotations. (To get the latest UniProt XML files, go to http://www.uniprot.org/, or you can use Uniprot_rat.xml as a sample file.)
Once the annotation load job is complete:
- Click Load Gene Ontology Data under Protein Annotations Loaded.
Import Protein Expression Data
- Create a new Protein Expression Matrix assay design. The default assay design will work with sample expression data provided here. For details, see Protein Expression Matrix Assay.
- Import the sample protein expression data into the assay design:
- Select Admin > Manage Assays.
- In the Assay List, click the expression assay you just created.
- Click Import Data.
- For FASTA/Uniprot File, select "rat.fasta".
- Click Choose File and select the file: ExpressionMatrix_Rat.xlsx.
- Click Save and Finish.
Create Joined Views
Now that the expression and annotation data is in place, you can create views that join the two together.
- Navigate to the expression data results table. (From the runs table, click the Assay ID link text ExpressionMatrix_Rat.xlsx.)
- Select Grid Views > Customize Grid.
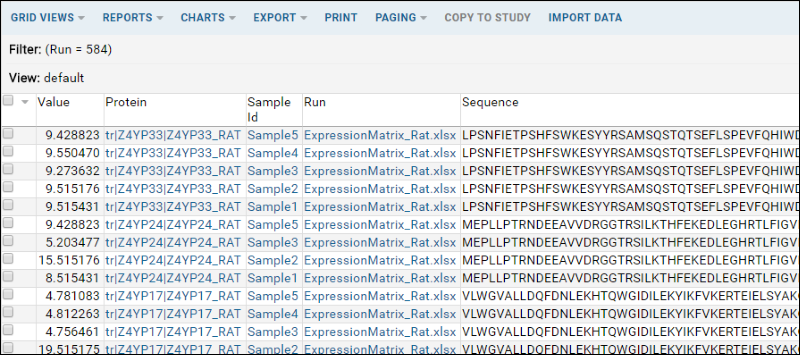
- Under Available Fields open the Protein node. The fields inside the Protein node hold annotation data you imported earlier. Select the fields of interest to add them to the view, for example, select Sequence. Also scroll down to see GO annotation fields, such GO Metabolic Processes, GO Cellular Processes, GO Molecular Functions.

- Once you have selected the desired fields, click Save, and Save again, to save the view as the default view.
- The joined view will be displayed as a grid:

Create a Custom Query on the Data
You can also create more sophisticated queries on the expression data / GO data. Below we will create an example query.
- Go to Admin > Developer Links > Schema Browser.
- Open the nodes assay and then ProteinExpressionMatrix in the lefthand pane, and then select the name of your assay design.
- Click Create New Query.
- Give the query a name, such as "Protein Counts"
- The table/query you base your custom query on can be any value, as we will overwrite the default query.
- Click Create and Edit Source.
- Delete the default SQL query that is provided, and copy and paste the SQL query below into the text area:
SELECT AVG(D.Value) AS Average,
a.SeqId,
a.AnnotVal AS Location,
COUNT(d.SeqId) AS ProteinCount,
D.SampleId,
a.AnnotTypeId.Name
FROM Data d, Protein.Annotations a
WHERE a.SeqId = d.SeqId
GROUP BY a.AnnotVal, D.SampleId, a.AnnotTypeId.Name, a.SeqId
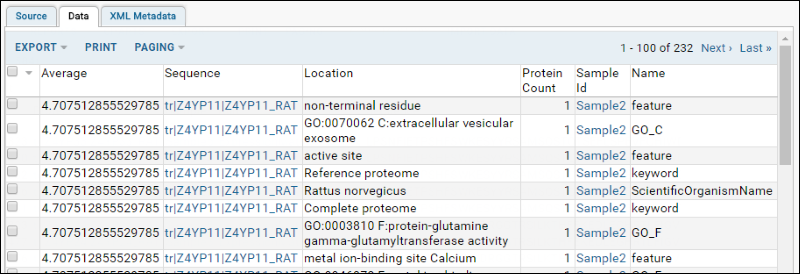
- Click Execute Query to see the results (shown on the Data tab):

- Return to the Source tab.
- Click Save and Finish to finalize the query.
If you like, you can now create a new web part to display this query on a folder page.
Related Topics