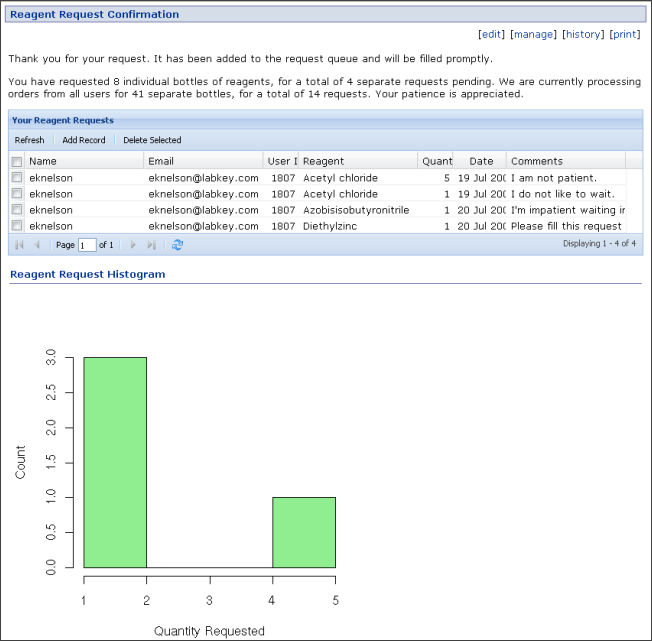
To further explore the possibilities available, let's add an R data visualization plot of the "Reagent Requests" list to the confirmation page, to create a page that looks like the following:

If you have not already configured your server to use R, follow these instructions before continuing: Install and Set Up R.
if(length(labkey.data$userid) > 0){
  png(filename="${imgout:histogram}")
  hist(labkey.data$quantity, xlab = c("Quantity Requested By ", labkey.url.params$displayName),
  ylab = "Count", col="lightgreen", main= NULL)
  dev.off()
} else {
  write("No requests are available for display.", file = "${txtout:histogram}")
}
http://localhost:8080/labkey/list/home/Request%20Reagent%20Tutorial/grid.view?listId=1&query.reportId=db%3A90
unencoded:
http://localhost:8080/labkey/list/home/Reagent Request Tutorial/grid.view?listId=1&query.reportId=db:90
This histogram gives a view of all requests listed in the "Reagent Requests" table.
<div id="reportDiv">Loading...</div>// Draw a histogram of the user's requests.
var reportWebPartRenderer = new LABKEY.WebPart({
partName: 'Report',
renderTo: 'reportDiv',
frame: 'title',
partConfig: {
title: 'Reagent Request Histogram',
reportId: 'db:XX',
showSection: 'histogram',
'query.UserID~eq' : LABKEY.Security.currentUser.id,
displayName: LABKEY.Security.currentUser.displayName
}
});
reportWebPartRenderer.render();
You will now see the histogram on the Reagent Request Confirmation page.
Link to a live example.
Note that the R histogram script returns data for all users. The wiki page does the work of filtering the view to the current user by passing a filtered view of the dataset to the R script (via the partConfig parameter of LABKEY.WebPart). To see the web part configuration parameters available, see: Web Part Configuration Properties.
When creating a filter over the dataset, you will need to determine the appropriate filter parameter names (e.g., 'query.UserID~eq'). To do so, go to the dataset and click on the column headers to create filters that match the filters you wish to pass to this API. Read the filter parameters off of the URL.
You can pass arbitrary parameters to the R script by adding additional fields to partConfig. For example, you could pass a parameter called myParameter with a value of 5 by adding the line "myParameter: 5,". Within the R script editor, you can extract URL parameters using the labkey.url.params variable, as described at the bottom of the "Help" tab.