[
Skyline Small Molecule Tutorial]
Using Panorama, you can import, parse, and view small molecule data inside of Skyline documents. Skyline documents containing mixed sets of peptides and small molecules can be imported. Panorama will separate the mixed peptides and small molecules into their respective views. Views provided inside Panorama include:
- Small Molecule Precursor List
- Small Molecule Summaries
- Small Molecule Details, including Chromatograms
All of these views are similar to the analogous peptide views, though spectrum graphs are not shown for small molecules.
Importing Small Molecule Documents
- Create or navigate to a Panorama type Folder.
- Configure the Panorama folder for Experimental Data. (For details see Configure Panorama Folder.)
- Click the Data Pipeline tab. In the Data Pipeline web part, click Process and Import Data.
- Drag and drop the individual Skyline documents or .zip file into the Files web part.
- When the documents have been uploaded, select the documents and click Import Data.
- In the Import Data popup menu, confirm that Import Skyline Results is selected, and click Import.
- When the import job is complete, click the Panorama Dashboard tab.
- In the Targeted MS Runs web part, click a Skyline document for views and details on the contents.
Available Views
The
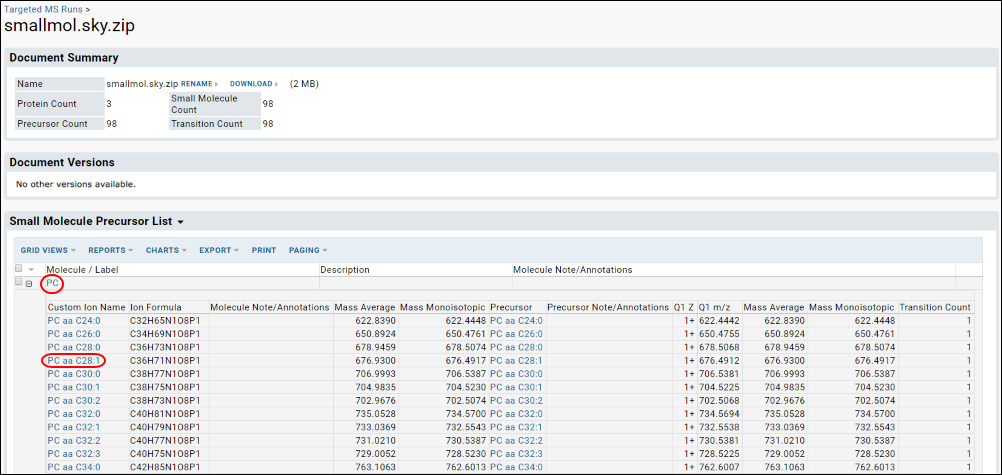
Small Molecule Precursor List shows a summary of the document contents.

- Click a value under the Custom Ion Name column for a details page.
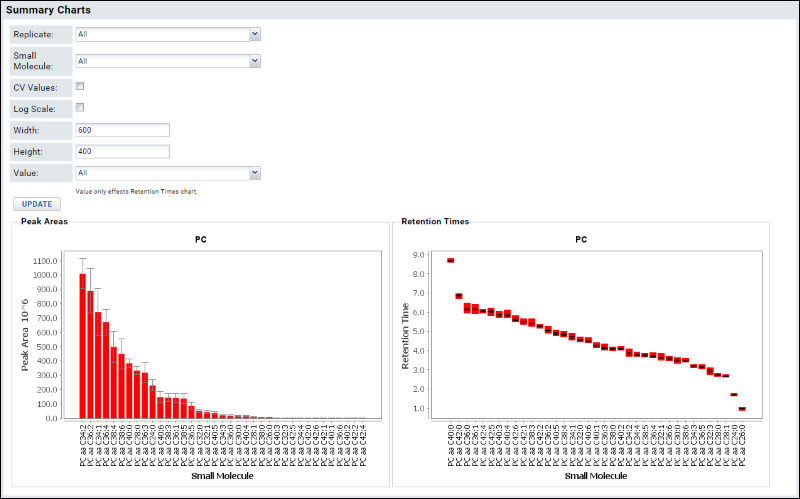
- Click the value under Molecule Label to see a summary page for the molecule group ("PC" in this case) which includes charts showing peak area and retention time information.

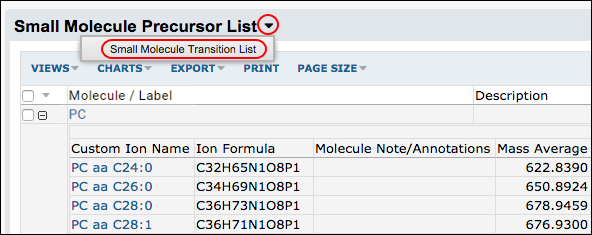
Clicking the triangle next to the title
Small Molecule Precursor List displays a link to the
Small Molecule Transitions List.

The
Small Molecule Transition List is shown below.

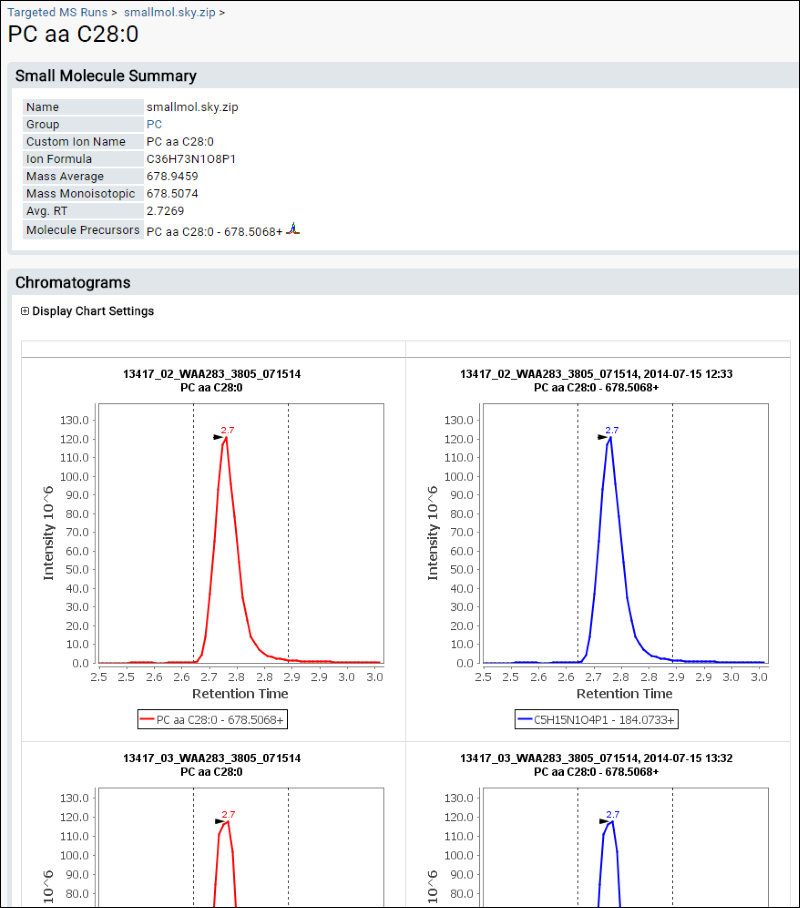
Ion Details
The following screen shot shows details and chromatograms for an ion.

Related Topics
- Use a Panorama QC folder to track the performance of instruments and reagents using Levey-Jennings plots, Pareto plots, and other tools for both proteomics and small molecule data.
Other Resources

 The Small Molecule Transition List is shown below.