Displaying a report or chart alongside other content helps you highlight visualizations of important results. There are a number of ways to do this, including:
Display a Single Report
To display a report on a page:
- Enter > Page Admin Mode.
- Click Add Web Part in the lower left, select Report, and click Add.
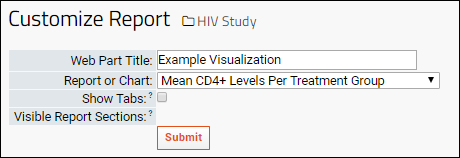
- On the Customize Report page, enter the following parameters:
- Web Part Title: This is the title that will be displayed in the web part.
- Report or Chart: Select the report or chart to display.
- Show Tabs: Some reports may be rendered with multiple tabs showing.
- Visible Report Sections: Some reports contain multiple sections, such as: images, text, console output. If a list is offered, you can select which section(s) to display by selecting them. If you are displaying an R Report, the sections are identified by the section names from the source script.
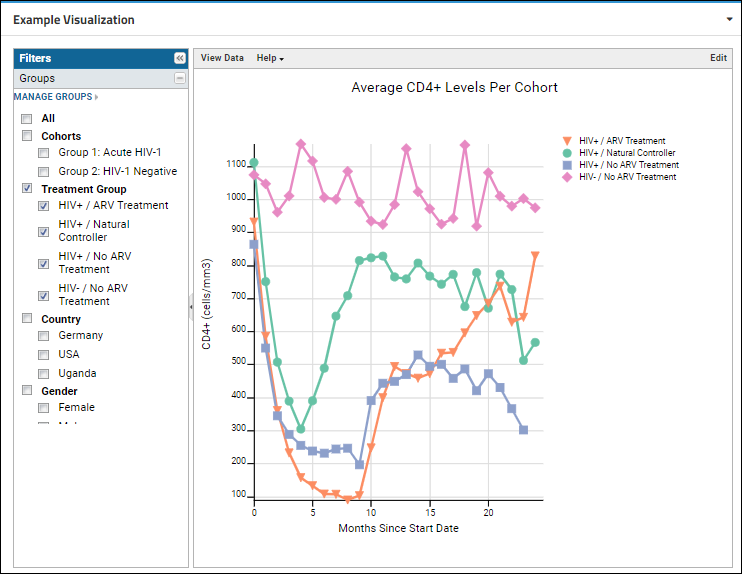
In this example, the new web part will look like this:
Change Report Web Part Settings
You can reopen the
Customize Report page later to change the name or how it appears.
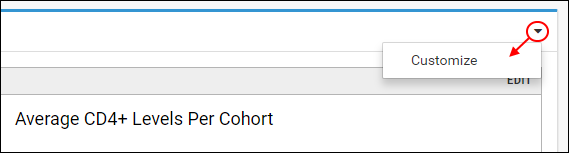
- Select Customize from the (triangle) menu.
Options available (not applicable to all reports):
- Show Tabs: Some reports may be rendered with multiple tabs showing. Select this option to only show the primary view.
- Visible Report Sections: Some reports contain multiple sections such as: images, text, console output. For these you can select which section(s) to display by selecting them from the list.
Related Topics

