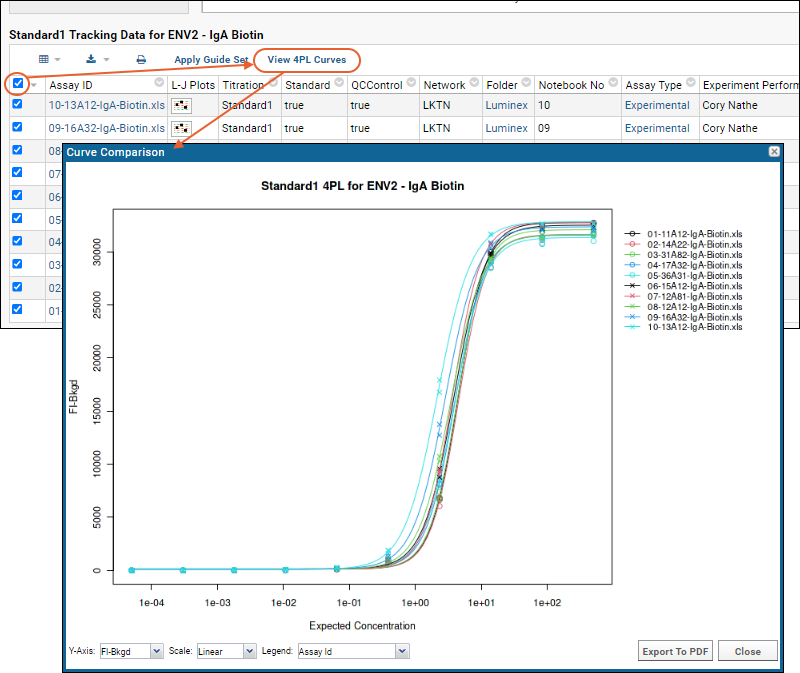
Plotting standard curves for several Luminex® runs together helps visualize any inconsistencies in data and curve fits between runs. The resulting overlay plot is sometimes called a curve "graveyard."
Here, we generate an overlay plot for the 4pl standard titration curves for the same data used in the previous tutorial steps.
Steps
If you navigated away after the last tutorial step, return to the Levey-Jennings plot for the ENV2 standard
- Select > Manage Assays in the Luminex folder.
- Click Luminex Assay 200.
- Select View QC Report > view levey-jennings reports.
- Click Standard1.
- In the Choose Graph Parameters box, select Antigen "ENV2", Isotype "IgA", Conjugate "Biotin" and click Apply.
Next, create the overlay plot:
- Scroll down to the Standard1 Tracking Data for ENV2 - IgA Biotin table.
- Select all rows. (Click the box at the top of the left hand column.)
- Click View 4pl Curves to generate the overlay plot.

In the
Curve Comparison popup, you can customize what is shown:
- Y-Axis: Use the pulldown to specify what is plotted on the Y-axis. Options: FI, FI-Bkgd, FI-Bkgd-Neg
- Scale: Choose linear or log scale.
- Legend: Use the pulldown to specify how the legend is labeled.
- Export to PDF - Export the overlay plot. The exported pdf includes both linear and log versions. View a sample here.
- Close the plot when finished.
Congratulations! You have completed the Luminex Tutorial Level II.
Related Topics