The CAVD DataSpace (CDS) data portal is a custom project developed by LabKey and the Statistical Center for HIV/ AIDS Research and Prevention (SCHARP) at the Fred Hutchinson Cancer Research Center (Fred Hutch). The goal is to help researchers gain new insights from completed studies, making integrated data from all studies available within a web-based interface for browsing. Learn more about this project and how to create an account for browsing in this topic:
Collaborative DataSpace: User Guide
To learn more about studies, assays, products, and reports, click the "Answer Questions" image on the DataSpace home page, or select
Learn About in the navigation panel on the right.
Tabs for browsing help you learn more about different aspects of the data:
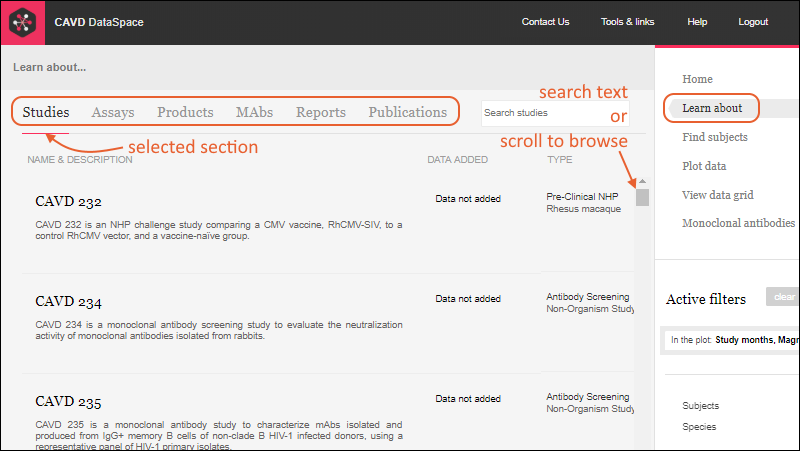
Access to the underlying subject-level data within any given studies is controlled separately from access to metadata about the study. On the "Learn About" pages, users without data access to a given study can still see information
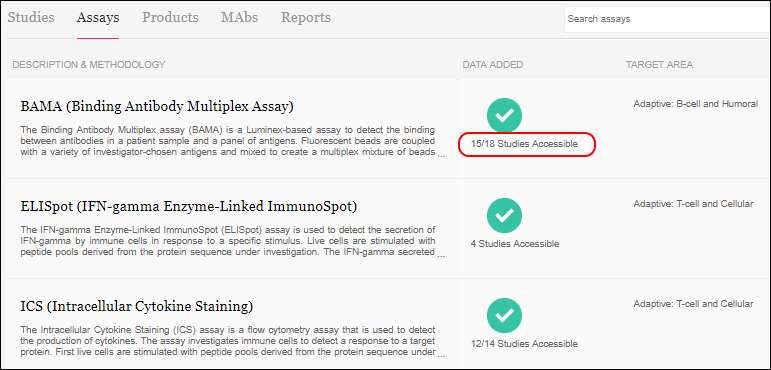
about the study, such as the type, target area, products used, etc. When the user has access to some but not all data, they will see a green check icon with a note indicating the fraction of data visible. In this example, there are 18 studies with BAMA (Binding Antibody Multiplex Assay) data, but this user can only view 15 of them:
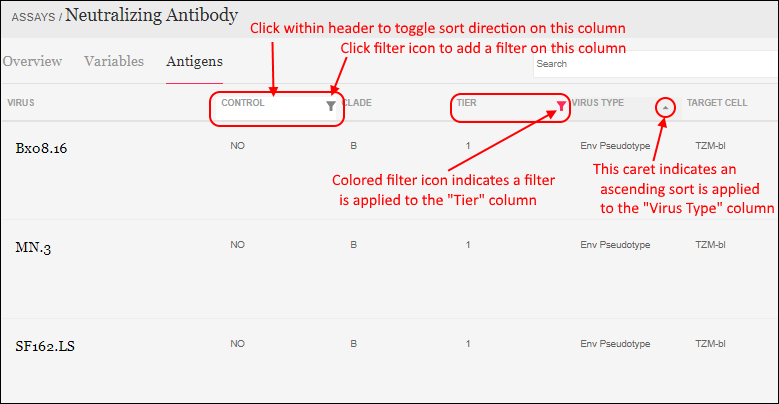
All grids offer the ability to search, sort, and filter the results shown. Click a column header to toggle between ascending and descending sort. Hover over a column and click the filter icon to add a column filter. When a column filter is applied, the filter icon is shown in color.
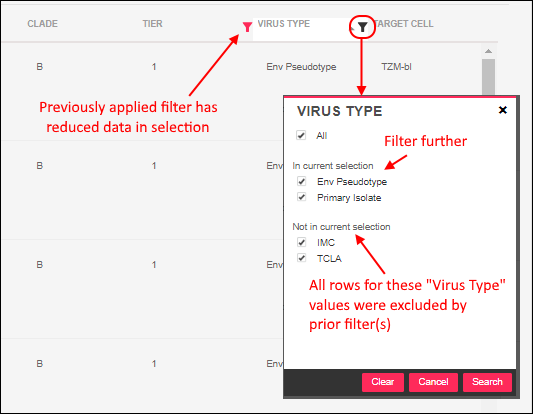
When you add a second column filter, the popup panel shows the values which still appear in the current selection. The values with "No data in current selection" have already been excluded by prior filtering.
The search or filter criteria you use are preserved, so if you visit one of the results and then click "Back" in your browser, you will return to the search results.
Studies
The available studies are listed with basic information like type, PI, and status. If data is available, an icon will be shown in the
Data Added column. A green check icon indicates the user has access to review some or all of that data. To learn more about a specific study, click the row to open a detail page.

Colored links to helpful information are provided throughout the details page, including contact personnel, portals for the study, and data including assays available. If a user does not have access to the underlying data, they will see a gray X (as shown above for ELISpot) instead of the green check shown above for the BAMA assay.
In addition to
Integrated data from the assays integrated into the DataSpace, a section for
Non-integrated data supports inclusion of other supplemental types of data. When the
(download) icon is shown, you can download the data.
Documents including the grant document can be provided in PDF or Word document format. On the Study Detail page, the documents to a given user are shown as colored links. Click the link to see or download the document. An administrator sets up the location and accessibility of study documents.
Related studies, study products, reports, curated groups (if any), and publications associated with this study can also be easily found from this page. Under the
Contact Information section, a set of links may include options to request support for an related study or to submit a research proposal or idea to the study group. If a specimen repository is available, you would also see a direct link to it in this section of the study details page.
Assays
The
Learn About > Assays tab shows a searchable list of all the assays within the DataSpace, including the target area and number of studies using them. Click an assay for a detail page.
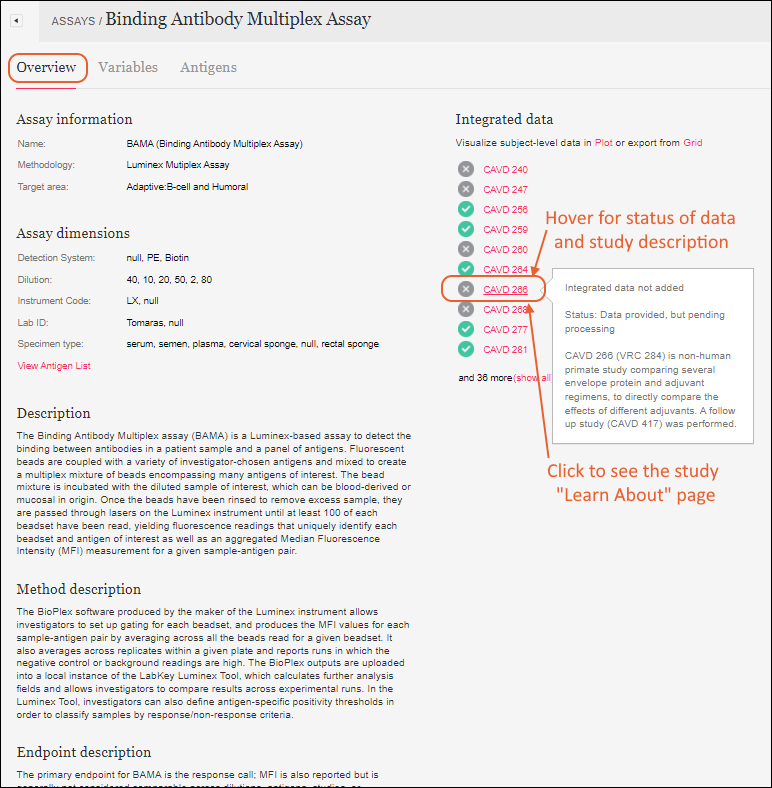
On the
Overview tab, the
Integrated data section shows studies containing data for this assay. Green or gray checks or 'X' icons indicate whether this user has access to data for this assay. If the list is long, the first 10 will be shown and there will be a
(show all) link to show the full list. Hover over the name of a study for a tooltip including the study description and also indicating status, such as:
- added
- being processed
- provided, but pending processing
- provided, but not included
- provided, but not machine readable
- not provided
- not included at this time
- not approved for sharing
Click a study name to see the "Learn about" page for the study itself.
If any
Interactive Reports have been included for this assay, you can access them from the Overview tab for the assay.
The
Variables tab shows variables applicable to the assay - the "Recommended" variables are listed first.
On the
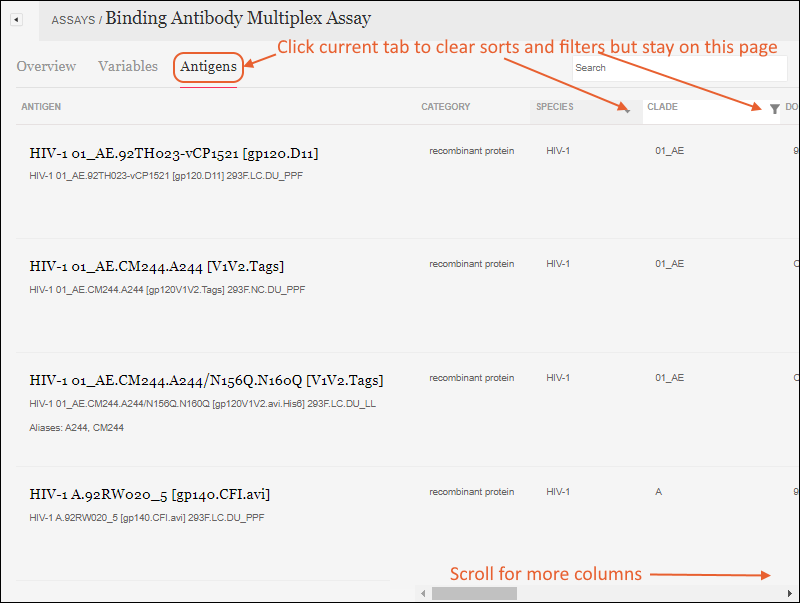
Antigens tab you will see a grid of information about the antigens for the assay. The scroll bar at the bottom provides access to many more columns. Click a column header to toggle ascending/descending sort on that column. Click a filter icon to add a filter.
As with other sorts and filters, they will be retained if you navigate away and then return to this page. Clicking the "Learn About" section header or the "Antigens" tab will clear the current sorts and filters so you can begin again. Also note that any sorting or filtering only applies to this current assay. Navigating to another assay will not see the same filters or sorts applied.
Products
The
Learn About > Products page offers a searchable list of the study products used. Clicking any product gives more information including further links to studies where the product is used.
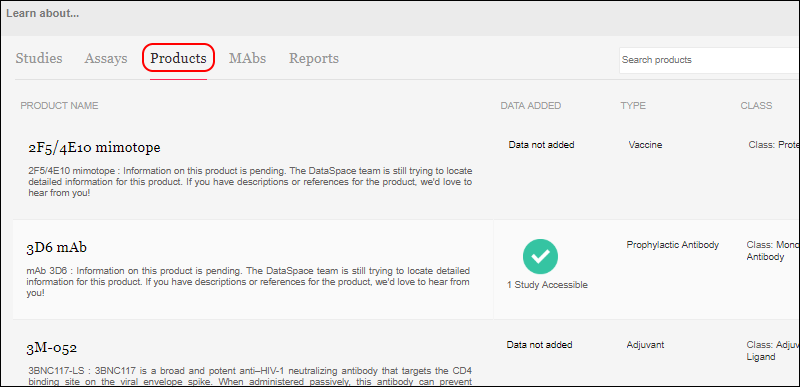
On the product details page, you can hover over study names under
Integrated Data to see the study description for quick reference.
MAbs
The
Learn About > Monoclonal Antibodies (MAbs) page provides an overview of all information about MAbs used in all studies. A user can filter and sort to locate studies involving MAbs of interest.
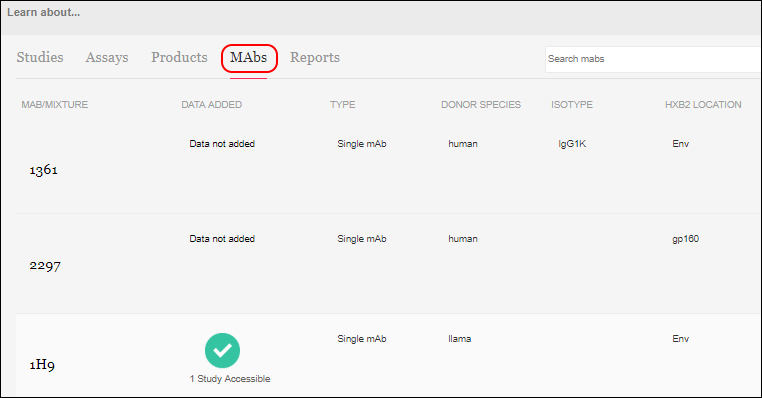
Columns available for filtering include:
- MAb/Mixture
- Data Added
- Type
- Donor Species
- Isotype
- HXB2 Location
- Antibody Binding Type
Clicking a row in the MAbs Learn About listing will open a detail page about that MAb with more detail about the mAb itself and IH9 details. You will also find links to studies that use this mAb:
- MAb Characterization Studies: Where mAbs themselves are the study subject.
- MAb Administration Studies: Where mAbs are used as a product.
Hover over any study name for a tooltip including the study description.
Reports
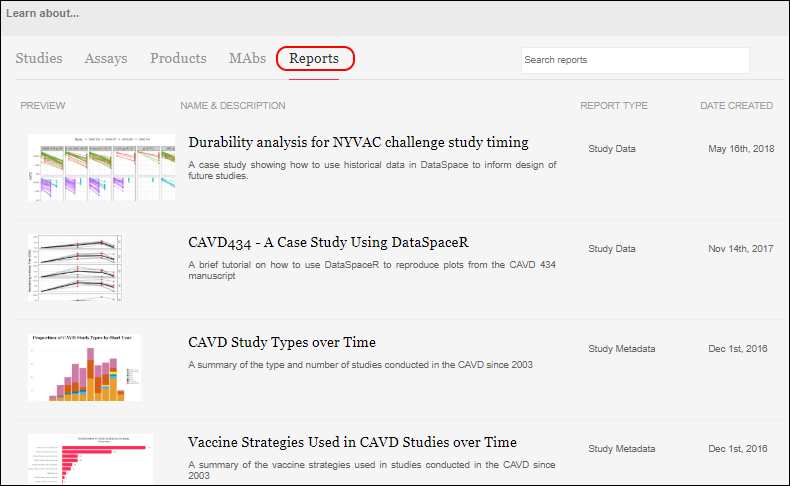
R and knitr reports can be made available in the DataSpace by creating them in the DataSpace project folder outside the application UI. R Reports defined in the top level project (not the study subfolders) and made visible to all users (public) will be listed on the
Reports tab of the
Learn About page. If there are no such reports defined, the tab will not be shown.
The thumbnail and basic information about the report is included in the searchable list. The category assigned outside the DataSpace UI is shown as the "Report Type" in this view. Clicking on any report will offer a detail page including the full report image.
Publications
The publications page lists all records from the publication tables, even if the publication is not associated with a study. You can search by any of the fields shown, including:
- Publication: the title and a brief excerpt
- Data Added: a green checkmark icon is shown when data has been added for this publication. Click for more details about this data.
- Journal
- First Author
- Publication Date (Default sort): Note that this field is not a date-time, but a string representation of the Year, Month, and Date provided. "YYYY MON DD". Any elements not included are omitted.
- Studies
- Pubmed ID
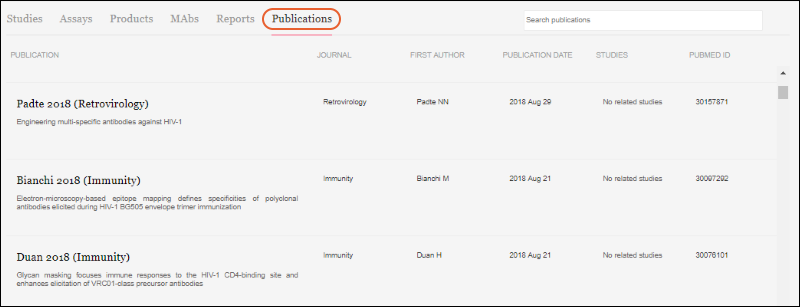
Clicking any row will show more details about the publication, including links to data availability within the DataSpace, when available.
Related Topics
 When you add a second column filter, the popup panel shows the values which still appear in the current selection. The values with "No data in current selection" have already been excluded by prior filtering.