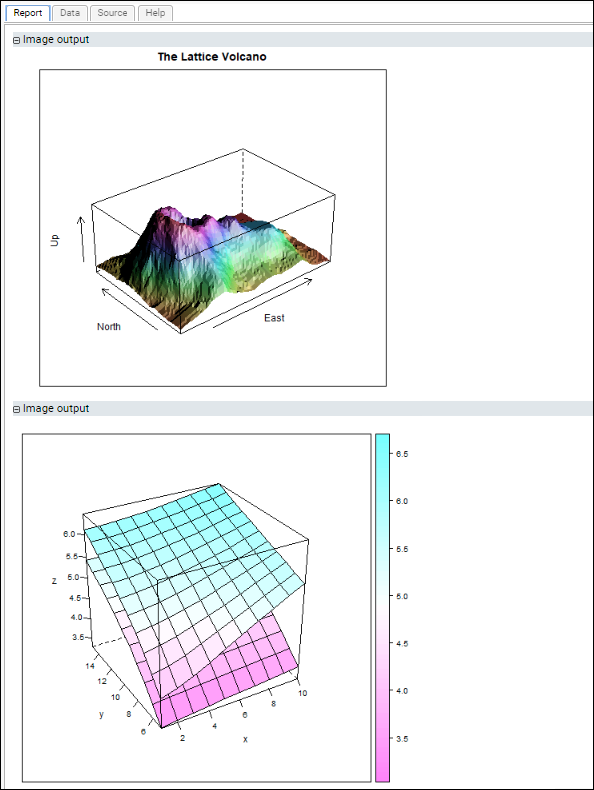
The "lattice" R package provides presentation-quality, multi-plot graphics. This page supplies a simple script to demonstrate the use of Lattice graphics in the LabKey R environment.
Before you can use the Lattice package, it must be
installed on your server.
You will load the lattice package at the start of every script that uses it:
Display a Volcano
The
Lattice Documentation on CRAN provides a Volcano script to demonstrate the power of Lattice. The script below has been modified to work on LabKey R:
library("lattice");

p1 <- wireframe(volcano, shade = TRUE, aspect = c(61/87, 0.4),
  light.source = c(10,0,10), zlab=list(rot=90, label="Up"),
  ylab= "North", xlab="East", main="The Lattice Volcano");
g <- expand.grid(x = 1:10, y = 5:15, gr = 1:2);
g$z <- log((g$x^g$g + g$y^2) * g$gr);

p2 <- wireframe(z ~ x * y, data = g, groups = gr,
  scales = list(arrows = FALSE),
  drape = TRUE, colorkey = TRUE,
  screen = list(z = 30, x = -60));

png(filename="${imgout:a}", width=500);
print(p1);
dev.off();

png(filename="${imgout:b}", width=500);
print(p2);
dev.off();
The report produced by this script will display two graphs that look like the following:

Related Topics
