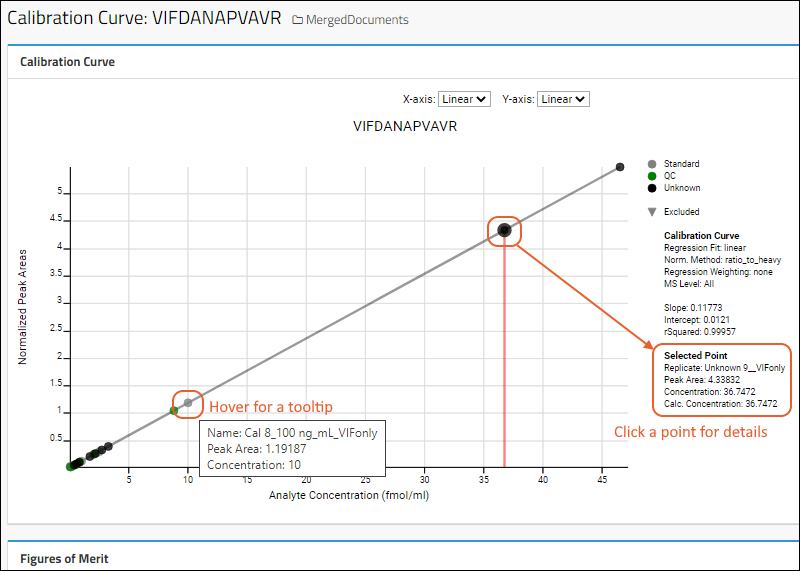
Calibration curves plot how a given metric changes with the concentration of an analyte and are used to calibrate an instrument.
View Calibration Curve
In the
Document Summary panel, click the
calibration curves link to see the available calibration curves.
Hover over any row to reveal a
(Details) button. Click to see the calibration curve plot.

Calculations round to 5th decimal digit. The calibration curve plot is rendered with a regression line.
Click a point in the plot to see its calculated concentration. Values are shown in the legend.

Below the plot, a panel of
Figures of Merit provides limit of detection and limit of quantitation details (when available). Learn more in this topic:
Panorama: Figures of Merit and Pharmacokinetics (PK)
Summary Charts
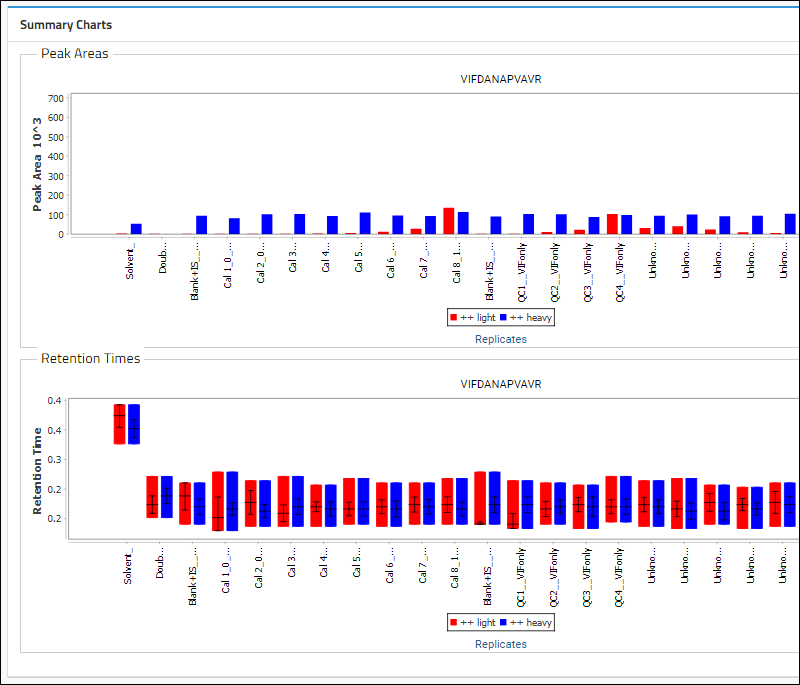
Summary charts show peak areas and retention times for the replicates in a bar and box plot format.

Quantitation Ratios
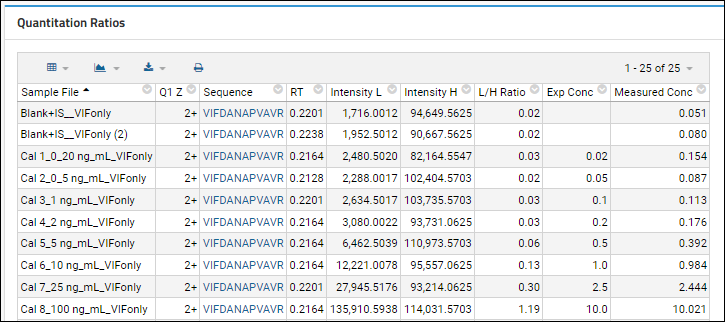
Below the summary charts, a table of Quantitation Ratios includes columns for the sample file, Q1 Z, Sequence, RT, Intensity L, Intensity H, L/H Ratio, Exp Conc, and Measured Conc.

Related Topics
 Calculations round to 5th decimal digit. The calibration curve plot is rendered with a regression line.Click a point in the plot to see its calculated concentration. Values are shown in the legend.
 Below the plot, a panel of Figures of Merit provides limit of detection and limit of quantitation details (when available). Learn more in this topic: Panorama: Figures of Merit and Pharmacokinetics (PK)