This topic describes how Panorama folder administrators can customize metrics, enable or disable them, and define new metrics of their own.
Set Metric Usage
An administrator can control which
QC metrics are available for quality control plots on a folder-by-folder basis.
Select the way in which you want metrics displayed in the current folder, and for the enabled metrics, how to identify outliers. Quieting display of outliers or disabling metrics may be practical for a variety of reasons, including if they produce many outliers without being diagnostic of real problems.
- Levey-Jennings (+/- standard deviations): (Default)
- Fixed value cutoff
- Fixed deviation from mean
- Show metric in plots, but don't identify outliers
- Disabled, completely hide the metric: Never show the metric in this folder.
The configuration menu is available on the
QC Plots web part.
- In the upper right of the QC Plots web part, open the (triangle) pulldown menu.

- Select Configure QC Metrics.
- The Type column indicates whether a metric is scoped to a single peptide/molecule (precursor) or to a run as a whole.
- Use the Metric usage pulldowns to select the desired usage for each metric in this folder.
- Customize outlier thresholds using the Lower bound/Upper bound columns.
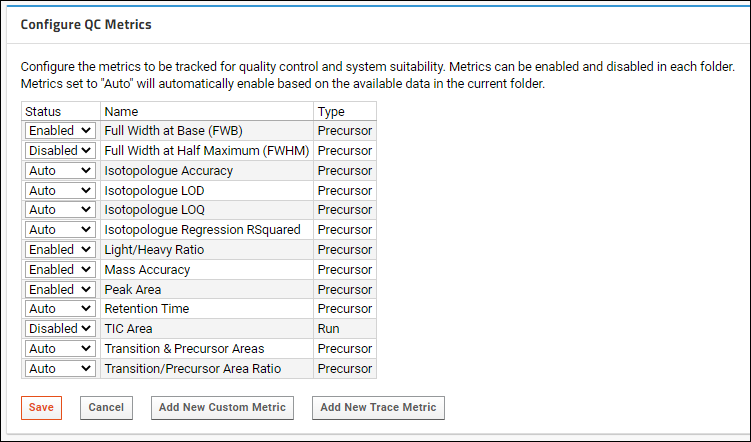
Customize Outlier Thresholds
Administrators can customize how outliers are defined per metric. These columns are only shown for
Levey-Jennings, Fixed value cutoff, and Fixed deviation from mean selections in the
Metric usage column.
By default, +/- 3 standard deviations are used for upper and lower bounds with Levey-Jennings outlier identification. On the
Configure QC Metrics page, edit the
Lower bound/Upper bound columns.
Fixed value cutoffs establish upper and lower bounds as discrete values, and are used for all precursors. It is useful for metrics like dot products (where one might set a lower bound of 0.90 and no upper bound), or mass error (where one might set a lower and lower bounds of -5 and 5 PPM.
Fixed deviation from the mean are applied on a per precursor basis, using the mean of the metric for that precursor. It is useful for metrics like retention time, where one might set lower and upper bounds of -1 and 1 to identify retention time shifts of one minute in either direction.
Means and standard deviations are calculated based on guide sets. If no guide sets are defined, all of the data for that metric is used.

Define Custom Metrics
An administrator can create their own custom metric by first defining a query, typically in the
targetedms schema, with the following columns:
| Name | Type | Description | Notes |
|---|
| MetricValue | NUMERIC | The value to be plotted | |
| SampleFileId | INT | Value of the related Id in targetedms.SampleFile | |
| PrecursorChromInfoId | INT | Value of the related Id in targetedms.PrecursorChromInfo. May be NULL, in which case there will be click handler for the point. | |
| SeriesLabel | VARCHAR | The peptide sequence, custom ion name, etc. | |
| DataType | VARCHAR | How to label the series in the overall list (typically either "Peptide", "Fragment", etc.) | |
| PrecursorId | INT | Value of the related Id in the targetedms.Precursor or targetedms.MoleculePrecursor table. | |
| mz | NUMERIC | mass to charge ratio | |
The fields PrecursorChromInfold must be included in a query for run-scoped metrics but should return NULL.
The fields SeriesLabel, DataType, PrecursorId, and mz are optional. They will be automatically calculated if they are missing, but you can use them to customize the display.
Once your query is defined, reopen the
Configure QC Metrics page from the web part menu and click
Add New Custom Metric.
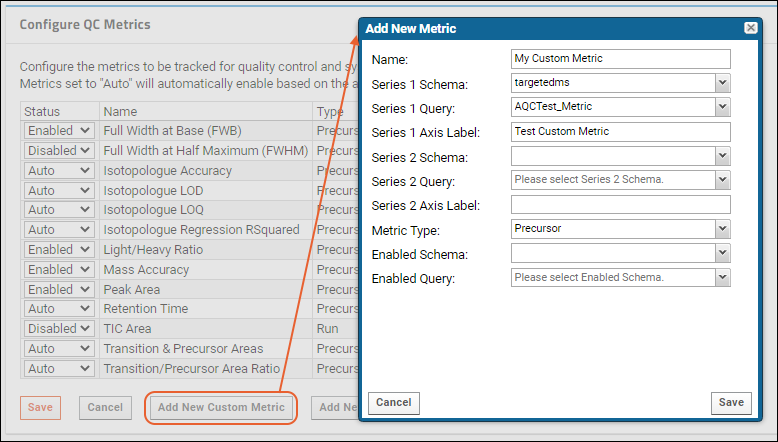
In the popup:
- Enter a Name
- Select the Schema and Query for Series 1.
- Give provide an Axis Label.
- If you would like a second Y-axis tracking a different schema and query, specify those in Series 2.
- Select the Metric Type:
- Precursor: This metric varies for each individual molecule.
- Run: This metric will have a single value per run, such as a maximum value of a pressure trace during a run.
- To be able to enable your metric based on the presence of data, supply the following:
- Enabled Schema: Schema in which to find the "Enabled" query.
- Enabled Query: Query to determine when to enable the metric.
- Click Save.
The new metric will appear on the metric configuration list as a clickable link. Click to see the definition. You can edit and save or delete if if necessary.
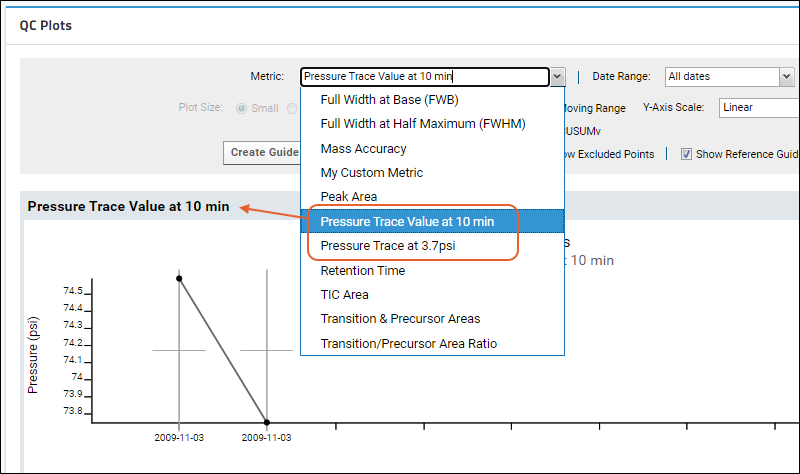
When enabled, your new metric will also be available in the QC Plots pulldown menu for plotting. If you created a molecule-scoped metric, each series will be titled with the value of the "SeriesLabel" column from the backing query.
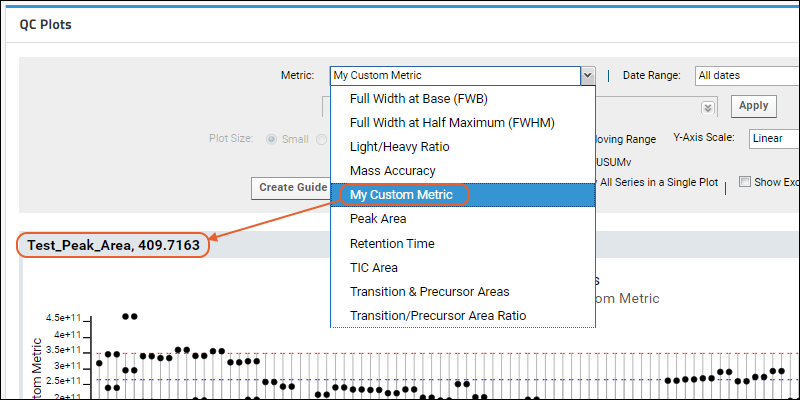
Example: Peptide ID Count
A real world example of adding a custom metric is to track the peptide ID counts in runs imported into the Skyline document in the folder. You can find an example of the steps used to create this metric, as well as an example data folder on PanoramaWeb:
Define Pressure Trace Metrics
Pressure traces, total ion current, and other chromatograms help monitor the performance of the mass spectrometry equipment. For example, a higher than normal value in system back pressure during the acquisition probably indicates the system is overpressure or starting to leak. Skyline will automatically extract pressure traces and other sample-scoped chromatograms from the raw files. When they're present, you can can monitor this at specific time points by configuring a metric to pull the pressure trace within the chromatogram at specific points in time, or track the time that a specified pressure value is reached.
There are two options for these metrics:
- Track trace value at user defined time (in minutes)
- Track time of user defined trace value
Open the
Configure QC Metrics page from the web part menu and click
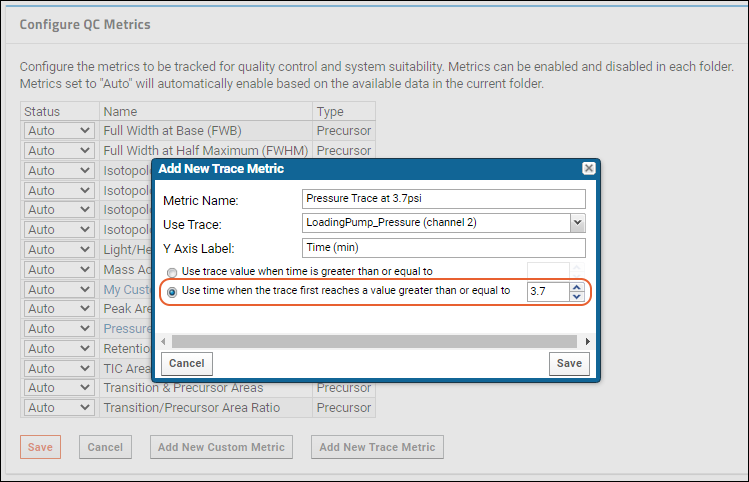
Add New Trace Metric. In the popup, specify:
- Metric Name: You can use the name to give users details about the metric.
- Use Trace: Select the trace to use. If this box reads "No trace can be found", you will not be able to create a trace metric.
- Y Axis Label: You can use this label to give information about units (PSI, etc.) as needed.
- Select the type of trace with the radio buttons:
Use trace value when time is greater than or equal to: Enter the number of minutes in the box.
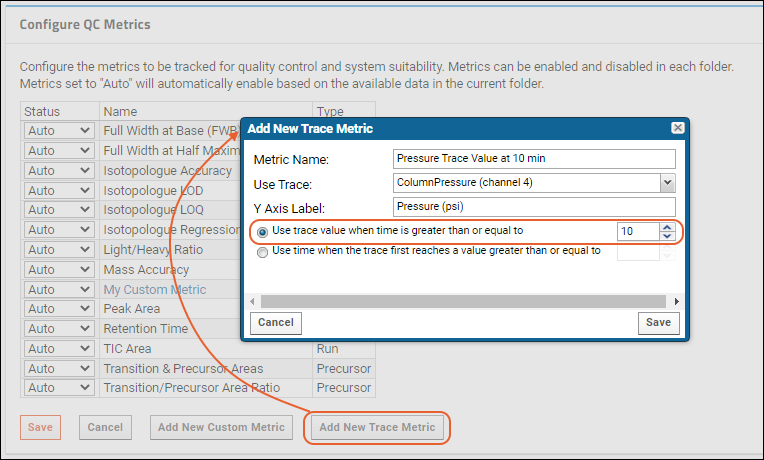 Use time when the trace first reaches a value greater than or equal to
: Enter the desired value in the box.
You can now view your new metric(s) in QC plots, outlier calculations, and automated emails.
Related Topics