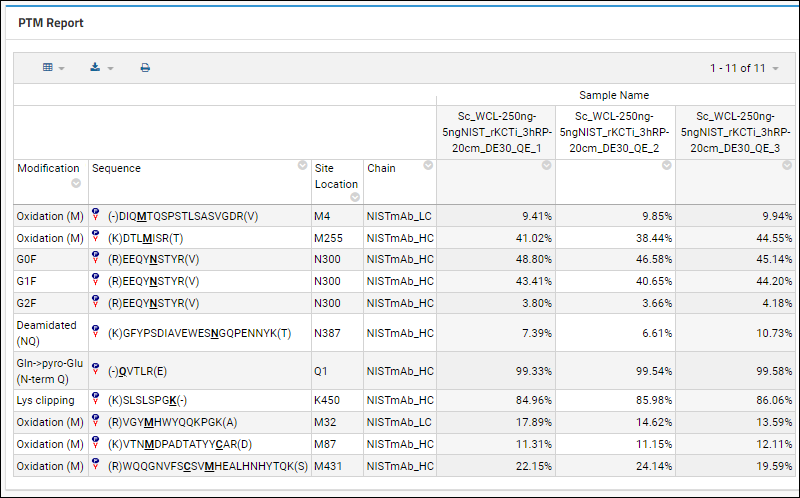
Post-translational Modification (PTM) Report
The Post-translational Modification (PTM) Report shows the proportion for each peptide variant's peak area across samples. Panorama automatically groups peptides with identical unmodified sequences, but a user can configure alternative groupings within the Skyline document, to group splice variants, for example.

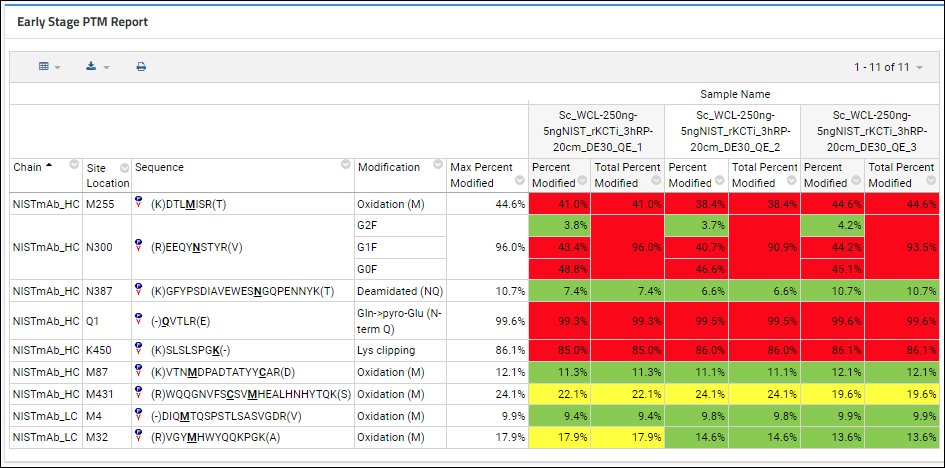
Early Stage PTM Report
Users doing early-stage antibody development want an efficient, automated way to assess the stability of their molecules and characterize the risk for each potential modification based on sample and protein criteria. The
Early Stage PTM Report addresses this need with the following key features:
- Stressed vs DS/FDS is a property of the sample, and captured in a Skyline replicate annotation, "Stressed or Non-Stressed"
- CDR vs Non-CDR is based on whether the modification sits in a "complementarity-determining region"
- These are the sections of the protein that are most important for its ability to bind to antigens
- They will be specified as a list of start/end amino acid indices within the protein sequence via a "CDR Range" annotation in the Skyline document, attached to the protein (aka peptide group). Example value for a protein with three CDRs: [[14,19],[45,52],[104,123]]
- CDR sequences within the overall peptide sequence are highlighted in bold.
- A Max Percent Modified column represents the maximum total across all of the samples. This lets the user filter out extremely low abundence modifications (like those that have < 1% modification)
Two pivot columns are shown for each sample in the Skyline document (shown as split columns). The headers show the value of the "Sample Description" replicate annotation, when present. Otherwise, they use the sample name.
- Percent Modified: Modification %, matching the value in the existing PTM report
- Total Percent Modified: Total modification %, which is the sum of all modifications at the same location (amino acid)
- When there is a single modification, it's the same value
- When there are multiple modifications, the "shared" cells span multiple rows
- Special case - for C-term modifications the value to be shown in the % that is NOT modified. That is, 100% - the modified percentage
Highlighting in red/yellow/green is applied based on whether the peptide is or is not part of a CDR sequence and whether it is observed in a stressed or non-stressed sample.

Peptide Map Report
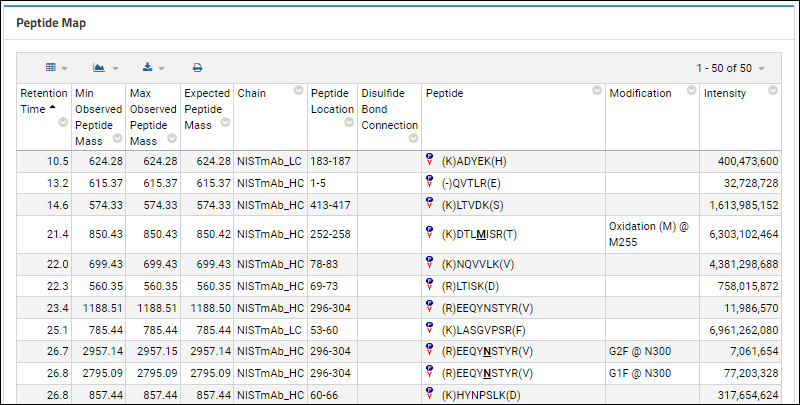
The Peptide Map Report shows the observed peptides in the MAM analysis, sorted by retention time.
- It compares the observed and expected masses, and the modifications for each peptide variant.
- Shows the protein chain and the peptide location as two separate columns instead of combining into a single column.
- Includes the next and previous amino acids in the Peptide column (each in parentheses).
- Shows the location of modifications on the protein/peptide sequence in addition to just the modification name.
