The
NAb Assay Tutorial covers the process of working with NAb data using a high-throughput assay and uploading data and metadata from files. This topic covers importing data from a low-throughput NAb assay. This process requires more data entry of specific metadata, and gives you the option to see the use of multiple data identifiers in action.
Create a New NAb Assay Design
- Select > Manage Assays.
- Click Configure Plate Templates.
- Select new 96 well (8x12) NAb single-plate template from the dropdown.
- Click Create to open the editor.

- Specify the following in the plate template editor:
- Provide a Template Name, for example: "NAb Plate 1"
- Leave all other settings at their default values (in order to create the default NAb plate).
- Click Save & Close.
- Select > Manage Assays.
- Click New Assay Design.
- Click the Specialty Assays tab.
- Under Use Instrument Specific Data Format, select TZM-bl Neutralization (NAb).
- As the Assay Location, select "Current Folder (NAb Assay Tutorial)" (your folder name may vary).
- Click Choose TZM-bl Neutralization (NAb) Assay.
- Specify the following in the assay designer:
- Name: "NAbAssayDesign"
- Plate Template: NAb Plate 1
- Metadata Input Format: Confirm Manual is selected for this tutorial.
- Leave all other fields at their default values.
- Click Save.
Import Data
When importing runs for this tutorial, you provide metadata, in this case sample information, manually through the UI. If instead you had a file containing that sample information, you could upload it using the
File Upload option for
Metadata Input Format. See
NAb Assay Reference for more information.
- Select > Manage Assays.
- On the Assay List, click NAbAssayDesign, then Import Data.
- For Participant/Visit, select Specimen/sample id. Do not check the box to also provide participant/visit information.
- Click Next and enter experiment data as follows:
| Property | Value |
|---|
| Assay Id | Leave blank. This field defaults to the name of the data file import. |
| Cutoff Percentage (1) | 50 |
| Cutoff Percentage (2) | 80 |
| Host Cell | T |
| Experiment Performer | <your name> |
| Experiment ID | NAb32 |
| Incubation Time | 30 |
| Plate Number | 1 |
| Curve Fit Method | Five parameter |
| Virus Name | HIV-1 |
| Virus ID | P392 |
| Run Data | Browse to the file: [LabKeyDemoFiles]\Assays\NAb\NAbresults1.xls |
|
| Specimen IDs | Enter the following (in the row of fields below the run data file): |
| Specimen 1 | 526455390.2504.346 |
| Specimen 2 | 249325717.2404.493 |
| Specimen 3 | 249320619.2604.640 |
| Specimen 4 | 249328595.2604.530 |
| Specimen 5 | 526455350.4404.456 |
|
| Initial Dilution | Place a checkmark and enter 20 |
| Dilution Factor | Place a checkmark and enter 3 |
| Method | Place a checkmark and select Dilution |
NAb Dashboard
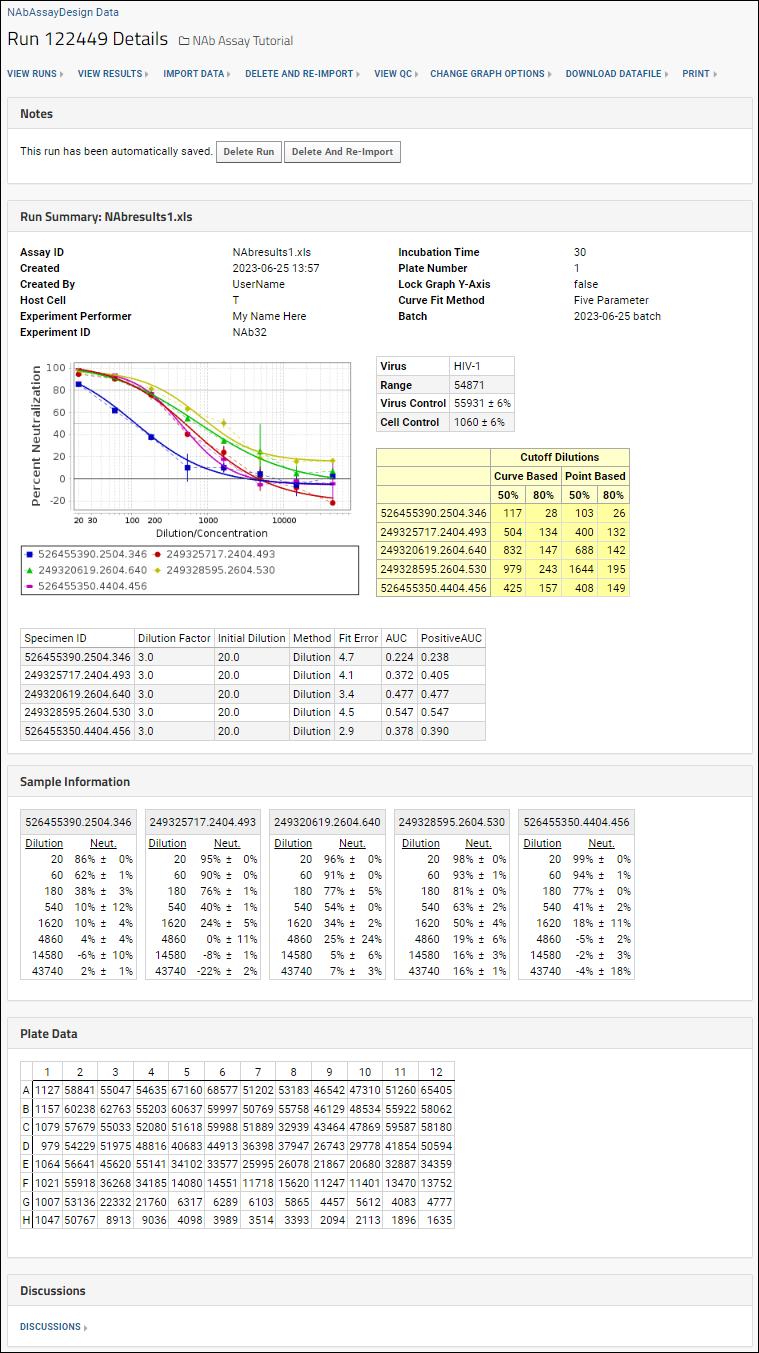
When the import is complete, you can view detailed information about any given run right away, giving quick confirmation of a good set of data or identifying any potential issues. The run summary dashboard looks something like this:

The percent coefficient of variation (%CV) is shown on the neutralization curve charts as vertical lines from each data point. Additional quality control, including excluding particular wells from calculations is available for NAb assays. See
NAb Assay QC for details.
As with
high-throughput NAb data you can customize graphs and views before integrating or sharing your results. Once a good set of data is confirmed, it could be
linked to a study or data repository for further analysis and integration.
Related Topics
