Chromatograms present in the Skyline file can be viewed from within Panorama with several display customization options. Depending on the type of chromatogram you are viewing, some or all of the features described in this topic will be available.
View Chromatograms
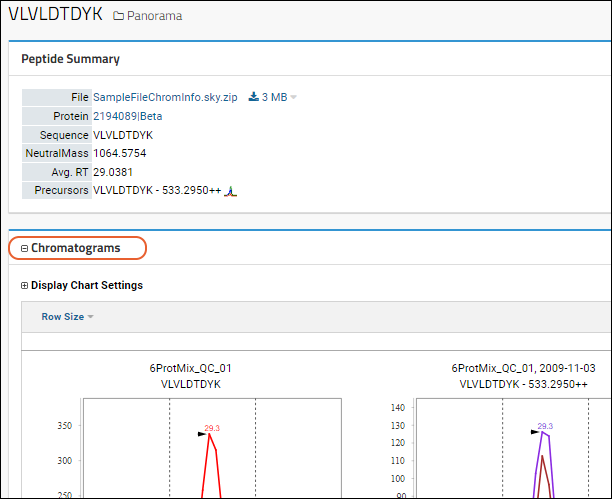
The details pages for proteins, peptides, small molecules, etc., include a panel of
Chromatograms.

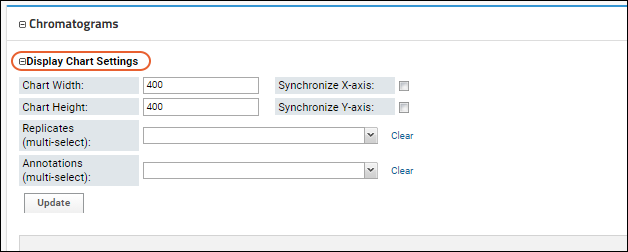
Display Chart Settings
Open the
Display Chart Settings panel, if it is not already expanded.

- Set the Chart Width and Height.
- Use checkboxes to Synchronize the X- and/or Y-axis if desired.
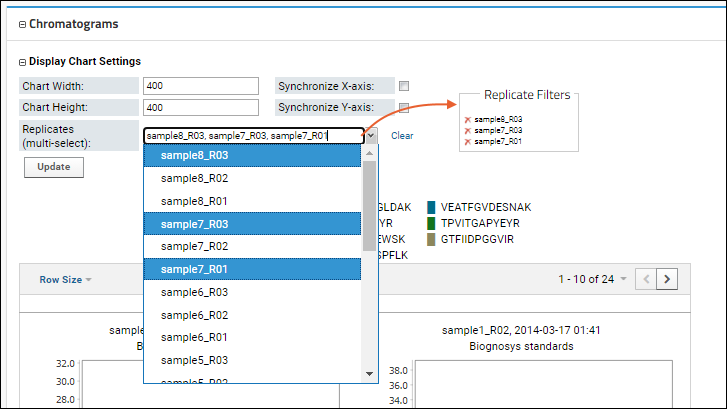
- Use the Replicates dropdown to multi-select the specific replicates for which you want to see the chromatograms, making it easier to compare a smaller number of interest.
- If the file also contains Annotations you can similarly multi-select the ones to display here.

Click
Update to apply your settings.
Choose Split or Combined Chromatograms
When there is chromatogram data for both the precursors and the transitions, you can select how to display them in the chromatograms:

In cases where the precursors' signal is much greater than the transitions', the latter will be almost an imperceptible bump at the bottom of the combined plot, so choosing the split option makes it clearer to view the signals.

Related Topics
 In cases where the precursors' signal is much greater than the transitions', the latter will be almost an imperceptible bump at the bottom of the combined plot, so choosing the split option makes it clearer to view the signals.