Heat maps are a powerful way to visualize expression matrix data.
Clustergrammer is a free visualization service and open source project provided by the Ma'ayan Lab at the Icahn School of Medicine at Mount Sinai. A heat map for data from runs in Panorama can be generated using the free web service version of Clustergrammer.
Generate a Clustergrammer Heat Map
- Navigate to the Panorama runs list of interest.
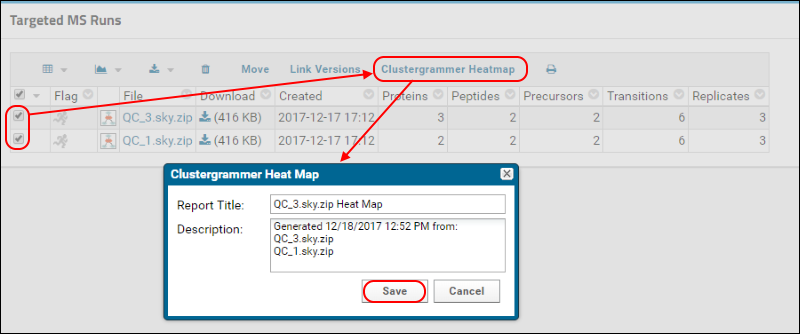
- Select the runs of interest and click Clustergrammer Heatmap.
- Adjust the auto-generated title and description if desired, or accept the defaults.
- Click Save.

- You'll be asked to confirm that you consent to publish the information to Clustergrammer. Clustergrammer is a third-party service, so all data sent will be publicly accessible. Click Yes if you wish to continue.
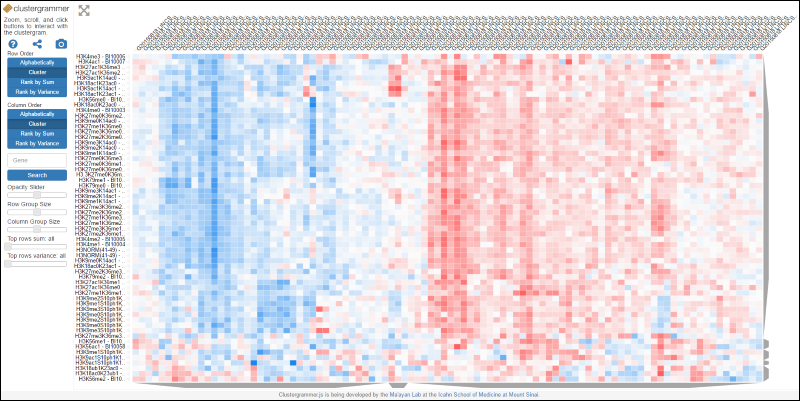
- The heat map will be generated and shown; depending on your run content, it might look something like this:

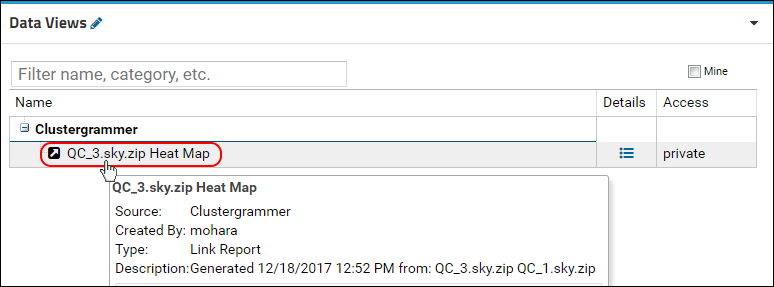
When you generate a Clustergrammer heat map, the server auto-generates a
Link Report giving you a way to access it later. To see the link report, add a
Data Views web part:
- Enter > Page Admin Mode.
- Select Data Views from the Add Web Part dropdown in the lower left.
- Click Add.
- Click Exit Admin Mode.

