In a file-based module, the
reports directory holds different kinds of reports and associated configuration files which determine how the reports are surfaced in the user interface.
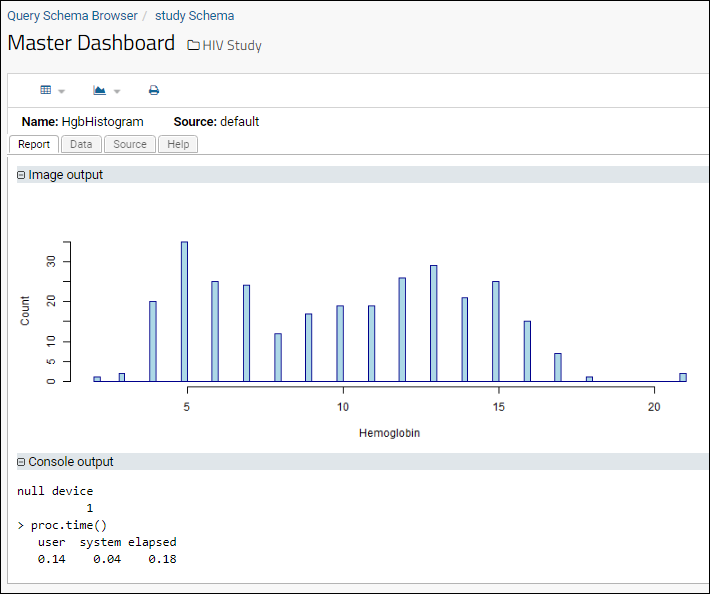
Below we'll make an R report script that is associated with the "MasterDashboard" query (created in the previous step).
- In the reports/ directory, create the following subdirectories: schemas/study/MasterDashboard, and a file named "HgbHistogram.r", as shown below:
fileBasedDemo
│ module.properties
└───resources
├───queries
│ └───study
│ │ BMI.sql
│ │ BMI.query.xml
│ │ MasterDashboard.sql
│ │
│ └───LabResults
│ DRV Regimen Results.qview.xml
│
├───reports
│ └───schemas
│ └───study
│ └───MasterDashboard
│ HgbHistogram.r
│
└───views
- Open the HgbHistogram.r file, enter the following script, and save the file.
png(
    filename="${imgout:labkeyl_png}",
    width=800,
    height=300)

hist(
    labkey.data$hemoglobin,
    breaks=100,
    xlab="Hemoglobin",
    ylab="Count",
    main=NULL,
    col = "light blue",
    border = "dark blue")

dev.off()
View Your R Report
- In your study folder, open the query browser via > Go to Module > Query.
- Click study, then MasterDashboard.
- Click View Data to run the query and view the results.
- View the new R report by selecting (Charts/Reports) > HgbHistogram.

Add Another Report
You can also add R reports on the "built-in" queries, which include provisioned datasets. To do so, name the directory for the table instead of the query. For example:
fileBasedDemo
│ module.properties
└───resources
├───queries
│ └───study
│ │ BMI.sql
│ │ BMI.query.xml
│ │ MasterDashboard.sql
│ │
│ └───LabResults
│ DRV Regimen Results.qview.xml
│
├───reports
│ └───schemas
│ └───study
│ └───LabResults
│ │ LymphCD4.r
│ └───MasterDashboard
│ HgbHistogram.r
│
└───views
Download this R script file and place it in the LabResults directory you just created:
Click the
Clinical and Assay Data tab and find this new R report in the
Assay section along with the LabResults dataset.
Related Topics
Tutorial Steps