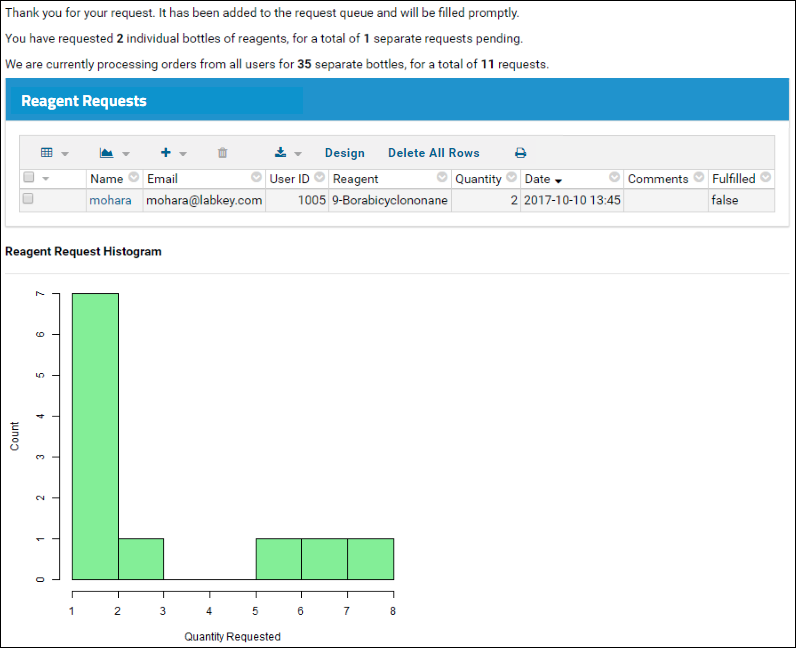
To further explore more possibilities available with JavaScript, let's add an R histogram (data visualization plot) of the "Reagent Requests" list to the confirmation page. This will create a page that looks like the following screencap.
This is an optional step. If you wish you can skip to the last step in the tutorial:
Step 4: Summary Report For Managers
Set Up R
If you have not already configured your server to use R, follow these instructions before continuing:
Install and Set Up R.
Create an R Histogram
- Return to the home page of your "Reagent Request Tutorial" folder by clicking the Reagent Request Tutorial link or using the project and folder menu.
- Select > Manage Lists.
- In the Available Lists grid, click Reagent Requests.
- Select (Reports) > Create R Report. If this option is not shown, you must configure R on your machine.
- Paste the following code onto the Source tab (replacing the default contents).
if(length(labkey.data$userid) > 0){
  png(filename="${imgout:histogram}")
  hist(labkey.data$quantity, xlab = c("Quantity Requested", labkey.url.params$displayName),
  ylab = "Count", col="lightgreen", main= NULL)
  dev.off()
} else {
  write("No requests are available for display.", file = "${txtout:histogram}")
}
- Check the "Make this report available to all users" checkbox.
- Scroll down and click Save.
- Enter the Report Name: "Reagent Histogram". We assume this value in the wiki page to display it.
- Click OK.
- Click the Report tab to see the R report.
This histogram gives a view of all requests listed in the "Reagent Requests" table.
Update the Confirmation Page
- Return to the main page by clicking the Reagent Request Tutorial link near the top of the page.
- Open the "Reagent Request Confirmation" wiki page for editing. Click it in the Pages web part, then click Edit. We will make three changes to customize the page:
- Add the following to the end of the block of <div> tags at the top of the page:
<div id="reportDiv">Loading...</div>
- This will give users an indication that additional information is coming while the histogram is loading.
- Uncomment the line marked with "// Uncomment below to filter the query to the current user's requests."
filters: [ LABKEY.Filter.create('UserID', LABKEY.Security.currentUser.id)],
- This will reduce the grid displayed; if you have not entered any sample requests, an empty table will be shown.
- Add the following to the init() function after the "//Extract a table..." section:
// Draw a histogram of the user's requests.
        var reportWebPartRenderer = new LABKEY.WebPart({
            partName: 'Report',
            renderTo: 'reportDiv',
            frame: 'title',
            partConfig: {
                title: 'Reagent Request Histogram',
                reportName: 'Reagent Histogram',
                showSection: 'histogram'
            }
        });
        reportWebPartRenderer.render();
You will now see the histogram on the Reagent Request Confirmation page.
If you see the error message "Unable to display the specified report," go back and confirm that the name of the report matches the name provided in the wiki content.
Link to a
live example.
Note that the R histogram script returns data for all users. The wiki page passes the report view of the dataset to the R script (via the
partConfig parameter of LABKEY.WebPart). To see the web part configuration parameters available, see:
Web Part Configuration Properties.
When creating a filter over the dataset, you will need to determine the appropriate filter parameter names (e.g., 'query.UserID~eq'). To do so, go to the dataset and click on the column headers to create filters that match the filters you wish to pass to this API. Read the filter parameters off of the URL.
You can pass arbitrary parameters to the R script by adding additional fields to partConfig. For example, you could pass a parameter called myParameter with a value of 5 by adding the line "myParameter: 5,". Within the R script editor, you can extract URL parameters using the labkey.url.params variable, as described at the bottom of the "Help" tab.
