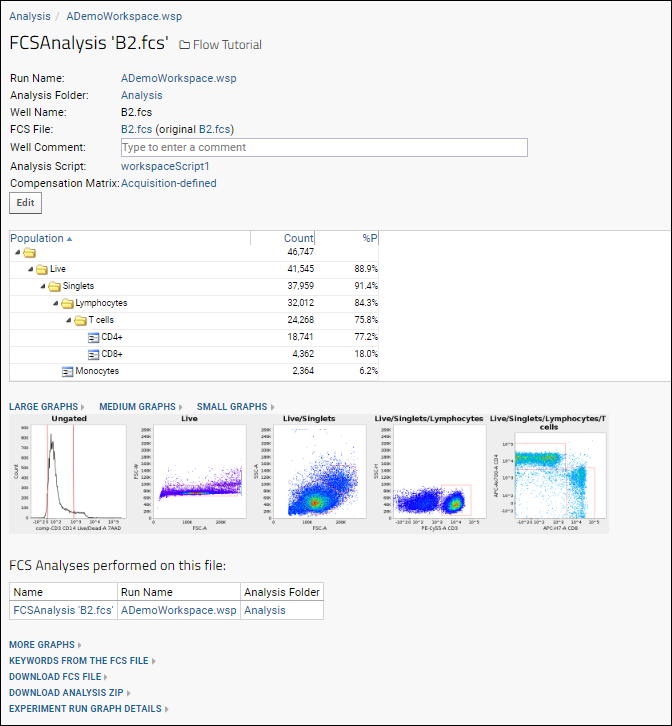
Detailed statistics and graphs for each
individual well can be accessed for any run. In this tutorial step, we review the details available.
Access Well Details
- Return to the flow dashboard in the Flow Tutorial folder.
- In the Flow Analyses web part, click Analysis then ADemoWorkspace.wsp to return to the grid.
- Hover over any row to reveal a (Details) link.

- Click it.
- The details view will look something like this:

You can see a similar online example
here.
View More Graphs
- Scroll to the bottom of the page and click More Graphs.
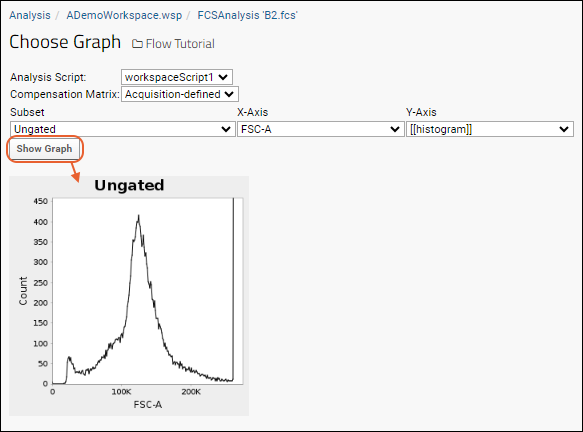
- This allows you to construct additional graphs. You can choose the analysis script, compensation matrix, subset, and both axes.
- Click Show Graph to see the graph.

View Keywords from the FCS File
- Go back in your browser, or click the FCSAnalysis 'filename' link at the top of the Choose Graph page to return to the well details page.
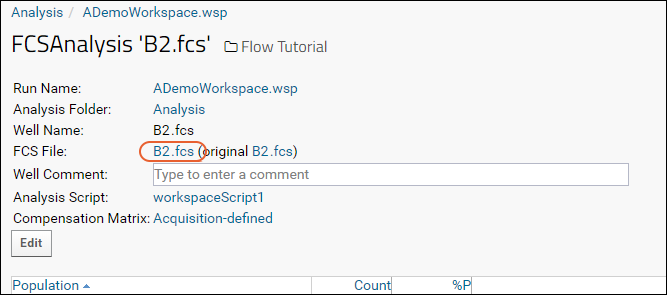
- Click the name of the FCS File.

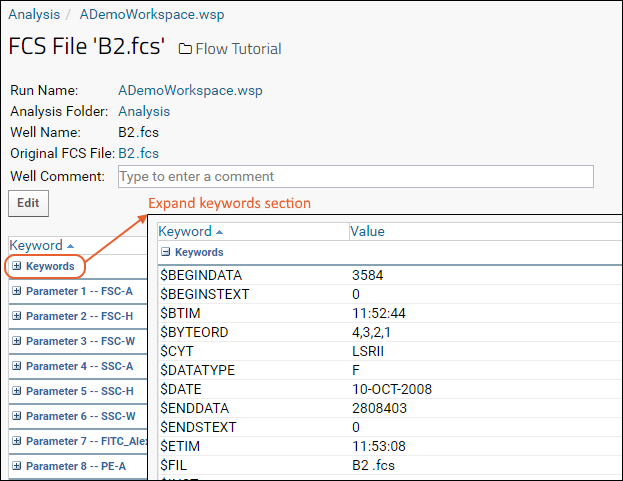
- Click the Keywords link to expand the list:

