A Panorama QC folder offers several plot types useful in quality control and monitoring system suitability. You can use these different plot types with the
different metrics and features described in this topic.
Metric Value Plots
The default plot in a Panorama QC folder is the Metric Value plot which shows the raw value of the metric and can be helpful in visualizing and analyzing trends and outliers. The metric value may be compared against fixed upper and lower bounds to identify outliers, or use a Levey-Jennings-style comparison based on the number of standard deviations (SD) it differs from the metric's mean value.

Configure metrics and outlier thresholds as described in this topic:
Moving Range Plots
The moving range can be plotted over time to monitor process variation for individual observations by using the sequential differences between two successive values as a measure of dispersion.
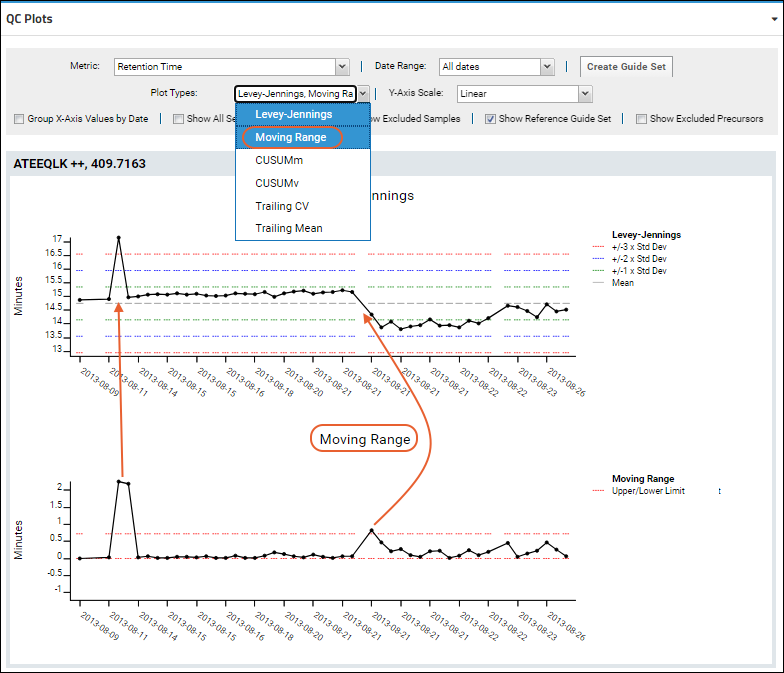
Moving Range (MR) plots can be displayed alongside Metric Value plots for integrated analysis of changes. To create a Moving Range plot, select this option from the Plot Types dropdown. Note that you can multiselect plot types here.
In this screencap, both the Metric Value and Moving Range plots are shown. Notice the two elevated points on the moving range plot highlight the largest changes on the other plot. Otherwise the value for retention time remained fairly consistent in two level 'zones'.

The plot configuration features outlined in
Panorama QC Plots also apply to Moving Range plots.
CUSUM Plots
A
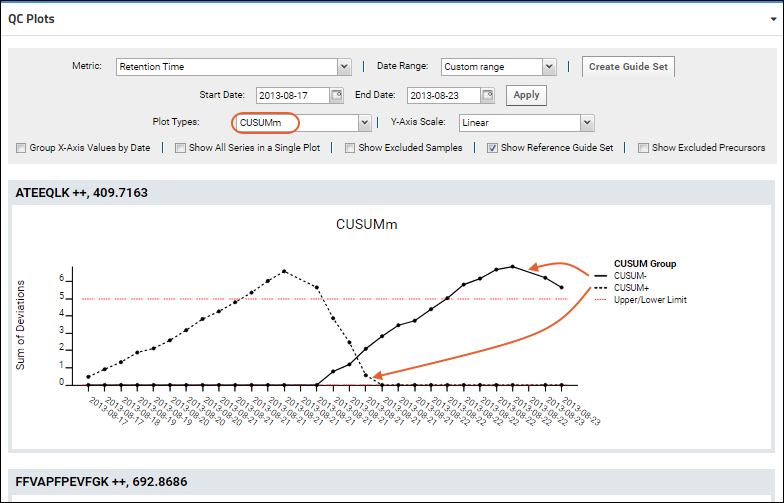
Cumulative Sum (CUSUM) plot is a time-weighted control plot that displays the cumulative sums of the deviations of each sample value from the target value. This can highlight a problem when seemingly small changes combine to make a substantial difference over time.
The legend for the dotted and solid lines is included on a CUSUM plot:
- CUSUM- is a solid line
- CUSUM+ is a dotted line
The plot configuration features outlined in
Panorama QC Plots also apply to both types of CUSUM plots.
CUSUMm (Mean CUSUM)
The CUSUMm (mean CUSUM) plots two types of CUSUM statistics: one for positive mean shifts and one for negative mean shifts.

CUSUMv (Variable CUSUM)
The CUSUMv (variability or scale CUSUM) plots two types of CUSUM statistics: one for positive variability shifts and one for negative variability shifts. Variability is a transformed standardized normal quantity which is sensitive to variability changes.
A sample CUSUMv plot, shown with no other plot type selected:

Trailing Mean and CV Plots
The
Trailing Mean and
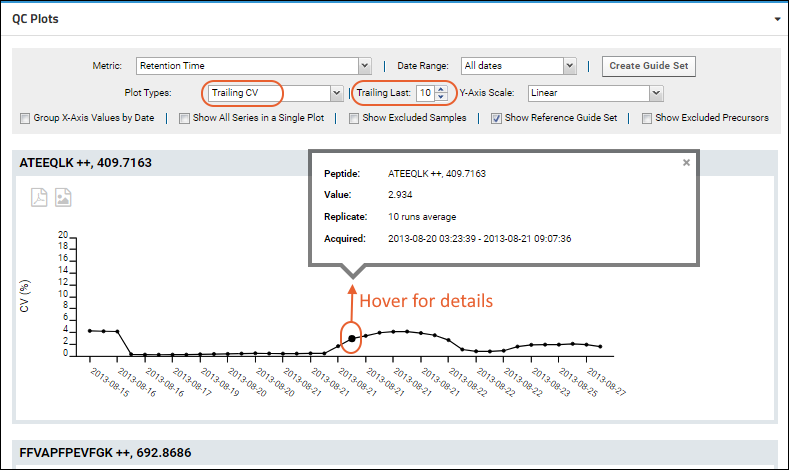
Trailing CV plots let the user set the number of previous samples over which they want the trailing value (mean or coefficient of variation, respectively) calculated for the metric selected. These plots are useful for finding long-term trends otherwise disguised by fluctuations caused by outliers.
After selecting either of the "Trailing" plots, you'll see a new
Trailing Last entry box for entering the number of runs to use to calculate the value. You must enter a positive integer, and fewer than the existing number of runs, otherwise you'll see an error message. The default is 10 samples (or all samples if there are fewer than 10 total).
The plot configuration features outlined in
Panorama QC Plots also apply to both types of "Trailing" plots. Hover over a point for more details, including:
- Peptide/Molecule: The peptide or small molecule name, charge state, and mZ value
- Value: The calculated trailing value over the last N samples
- Replicate: Number of samples used (N)
- Acquired: Data acquisition begin and end dates for the samples included
Trailing Coefficient of Variation
A Trailing Coefficient of Variation plot shows the percent coefficient of variation for a selected metric over the previous N samples, as defined by the user.

The Y-axis will show the CV(%).
Trailing Mean
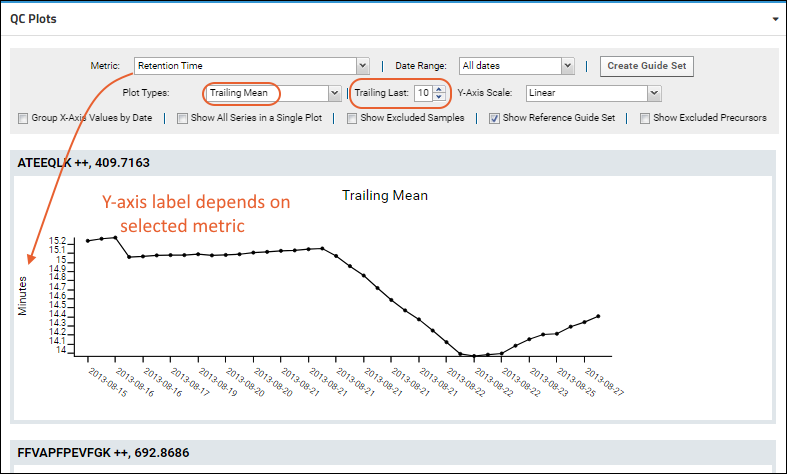
A Trailing Mean plot shows the average of a selected metric over the previous N samples, as defined by the user.

The Y-axis for the Trailing Mean plot will vary based on the metric selected for the plot. Some plot types don't label the Y-axis.
| Metric | Y-axis for Trailing Mean |
|---|
| Full Width at Base (FWB) | Minutes |
| Full Width at Half Maximum (FWHM) | Minutes |
| Mass Accuracy | PPM |
| Retention Time | Minutes |
| TIC Area | Area |
| Total Peak Area | Area |
Related Topics