Lineage relationships established through the
experiment framework or using the
run builder are displayed on the Run Details panel. Either start from the
Run Details and click the
Graph Summary View tab, or click the graph icon in the
Experiment Runs web part.

Graph Summary View
The
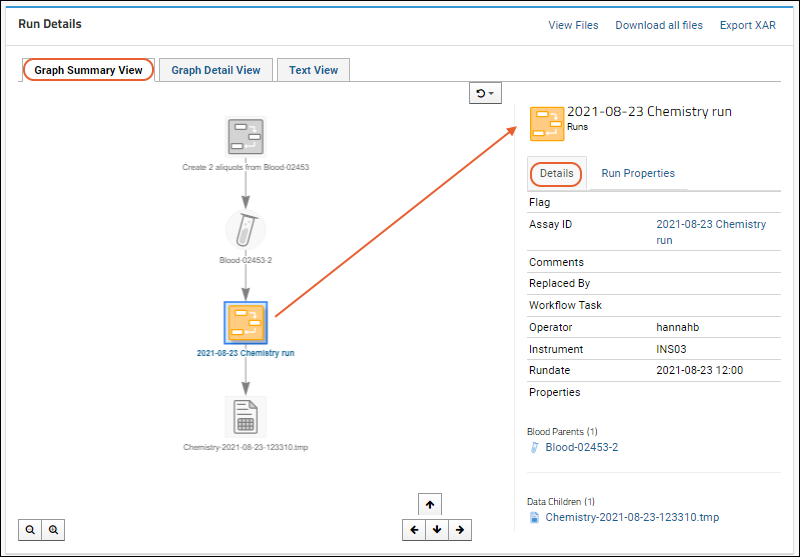
Graph Summary View shows the overall run process. The currently 'selected' node will show
Details to the right and you can click to select other nodes for their details.

You may instead see a legacy graph format and a
Toggle Beta Graph button to switch to the above view. Learn more
below).
Run Properties
The
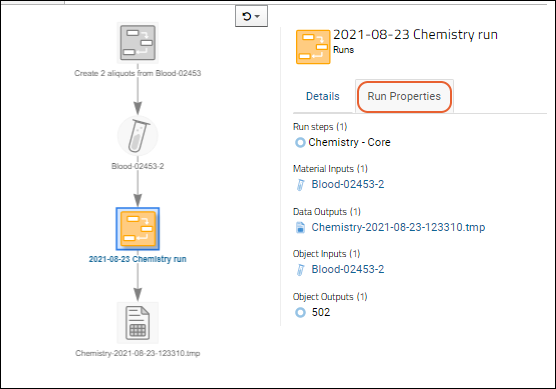
Run Properties tab on the
Graph Summary View presents the properties defined for this run.

Graph Detail View
The
Graph Detail View tab focuses on one part of the graph. Click any node to see the detail page.
Text View
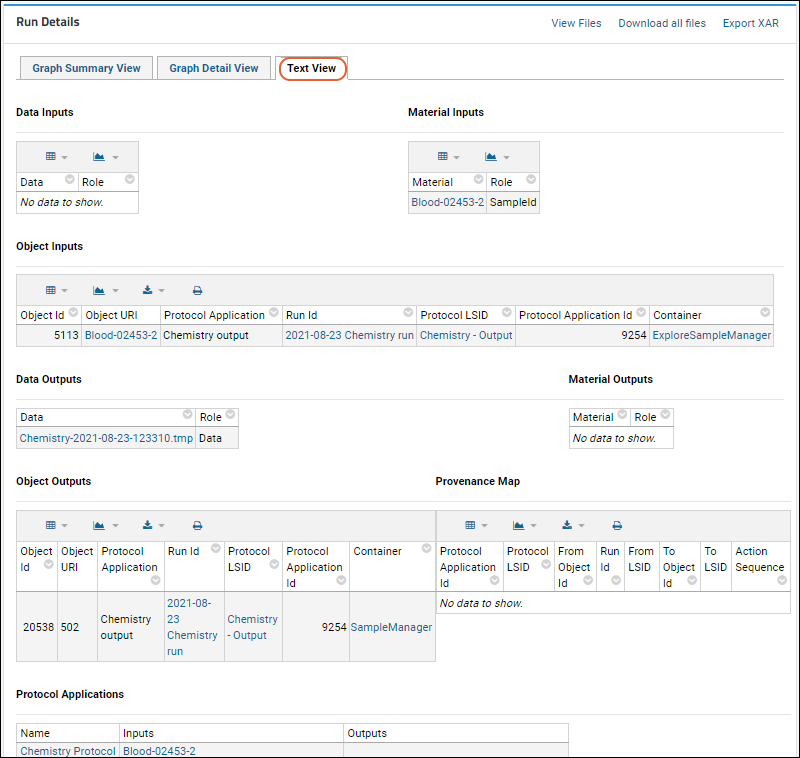
The
Text View tab gives a table and text based overview of the run.

Legacy Experiment Run Graph Notation
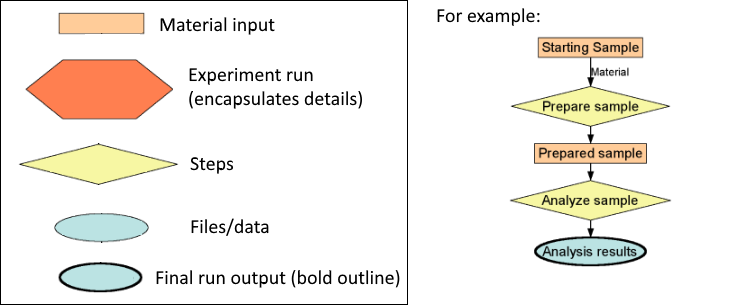
Experiment run graphs are presented using the following graphical notation representing the flow of the experiment.

For example, the above
graph is represented like this in the legacy view:

Related Topics