If you have a flow cytometry experiment containing a background control (such as an unstimulated sample, an unstained sample, or a Fluorescence Minus One (FMO) control), you can set the background in LabKey for use in analysis. To perform this step we need to:
- Identify the background controls
- Associate the background values with their corresponding samples of interest
This tutorial shows you how to associate sample descriptions with flow data, define and set new keywords, and set metadata including background information. Positive and negative responses can then be calculated against this background.
To gain familiarity with the basics of the flow dashboard, data grids, and using graphs, you can complete the
Tutorial: Explore a Flow Workspace first. It uses the same setup and sample data as this tutorial.
Tutorial Steps:
Set Up
To set up a
"Flow Tutorial" folder, and import the sample data package, complete the instructions in this topic:
Upload Sample Descriptions
Sample descriptions give the flow module information about how to interpret a group of FCS files using keywords. The flow module uses a sample type named "Samples" which you must first define and structure correctly. By default it will be created at the project level, and thus shared with all other folders in the project, but there are
several options for sharing sample definitions. Note that it is important not to rename this sample type. If you notice "missing" samples or are prompted to define it again, locate the originally created sample type and restore the "Samples" name.
Download these two files to use:
- Navigate to your Flow Tutorial folder. This is your flow dashboard.
- Click Upload Samples (under Manage in the Flow Summary web part).
- If you see the Import Data page, the sample type has already been defined and you can skip to the next section.
- On the Create Sample Type page, you cannot edit the name "Samples".
- In the Naming Pattern field, enter this string to use the "TubeName" column as the unique identifier for this sample type.
- You don't need to change other defaults here.

- Click the Fields section to open it.
- Click the for the Default System Fields to collapse the listing.
- Drag and drop the "Fields_FlowSampleDemo.fields.json" file into the target area for Custom Fields.
- You could instead click Manually Define Fields and manually add the fields.
- Ignore the blue banner asking if you want to add a unique ID field.
- Check that the fields added match the screencap below, and adjust names and types if not.
- Learn more about the field editor in this topic: Field Editor.
- Ignore any banner offering to add a unique ID field.
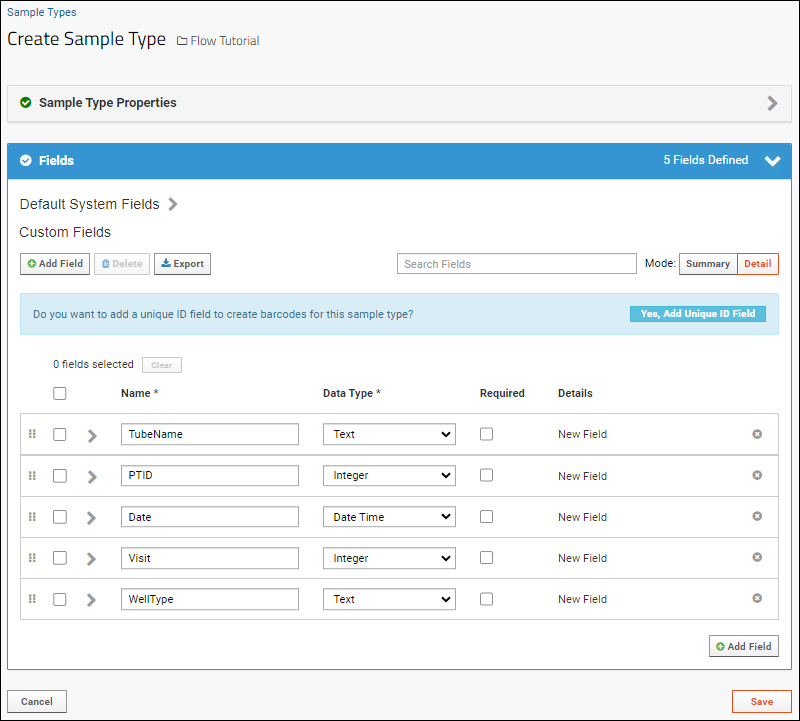
- Click Save.
- Return to the main dashboard by clicking the Flow Tutorial link near the top of the page.
You have now defined the sample type you need and will upload the actual sample information next.
Upload Samples
- In the Flow Tutorial folder, click Upload Samples.
- You can either copy/paste data as text or upload a file. For this tutorial, click Upload File.
- Leave the default Add samples selected.
- Click Browse to locate and select the "FlowSampleDemo.xlsx" file you downloaded.
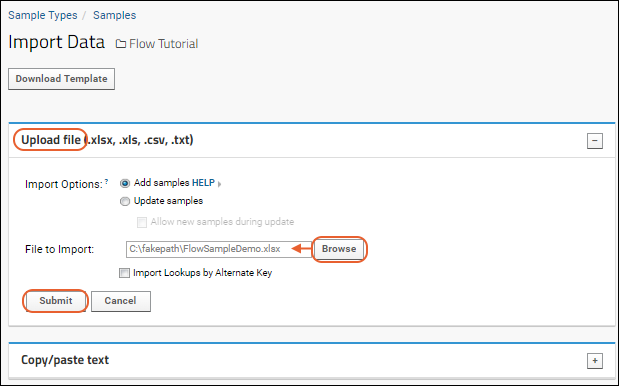
- Do not check the checkbox for importing by alternate key.
- Click Submit.
Once it is uploaded, you will see the sample type.
Associate the Sample Descriptions with the FCS Files
- Return to the main dashboard by clicking the Flow Tutorial link near the top of the page.
- Click Define Sample Description Join Fields in the Flow Experiment Management web part.

- On the Join Samples page, set how the properties of the sample type should be mapped to the keywords in the FCS files.
- For this tutorial, select TubeName from the Sample Property menu, and Name from the FCS Property menu

You will see how many FCS Files could be linked to samples. The number of files linked to samples may be different from the number of sample descriptions since multiple files can be linked to any given sample.
To see the grid of which samples were linked to which files:
- Click the Flow Tutorial link.
- Then click 17 sample descriptions (under "Assign additional meanings to keywords").

- Linked Samples and FCSFiles are shown first, with the values used to link them.
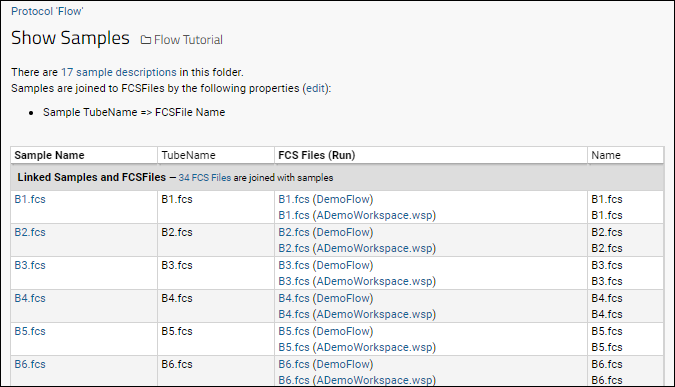
- Scroll down to see Unlinked Samples and Unlinked FCSFiles, if any.

Add Keywords as Needed
Keywords imported from FlowJo can be used to link samples, as shown above. If you want to add additional information within LabKey, you can do so using additional keywords.
- Return to the main Flow Tutorial dashboard.
- Click 17 FCS files under Import FCS Files.

- Select the rows to which you want to add a keyword and set a value. For this tutorial, click the box at the top of the column to select all rows.
- Click Edit Keywords.

- You will see the list of existing keywords.
- The blank boxes in the righthand column provide an opportunity to change the values of existing keywords. All selected rows would receive any value you assigned a keyword here. If you leave the boxes blank, no changes will be made to the existing data.
- For this tutorial, make no changes to the existing keyword values.

- Click Create a new keyword to add a new keyword for the selected rows.
- Enter "SampleType" as the keyword, and "Blood" as the value.

- Click Update.
- You will see the new SampleType column in the files data grid, with all (selected) rows set to "Blood".
If some of the samples were of another type, you could repeat the "Edit Keywords" process for the subset of rows of that other type, entering the same "SampleType" keyword and the alternate value.
Set Metadata
Setting metadata including participant and visit information for samples makes it possible to integrate flow data with other data about those participants.
Background and foreground match columns are used to identify the group -- using subject and timepoint is one option.
Background setting: it is used to identify which well or wells are background out of the group of wells. If more than one well is identified as background in the group, the background value will be averaged.
Use Background Information
- Click the Flow Tutorial link near the top of the page to return to the main flow dashboard.
- Click the Analysis Folder you want to view, here Analysis (1 run), in the Flow Summary web part.
- Click the name ADemoWorkspace.wsp to open the grid of workspace data.
Control which columns are visible using the standard grid customization interface, which will include a node for background values once the metadata is set.
- Select (Grid Views) > Customize Grid.
- Now you will see a node for Background.
- Click the icon to expand it.
- Use the checkboxes to control which columns are displayed.
- If they are not already checked, place checkmarks next to "BG Count", "BG Live:Count", "BG Live:%P", and "BG Singlets:Count".
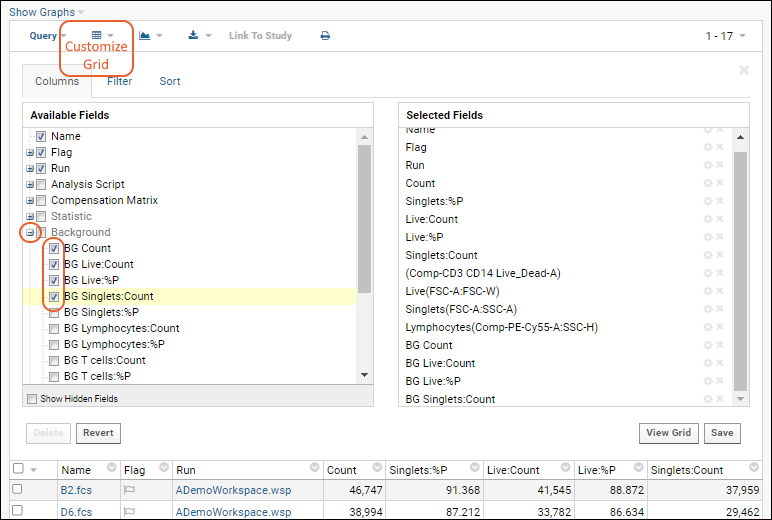
- Click Save, then Save in the popup to save this grid view as the default.

Return to the view customizer to make the source of background data visible:
- Select (Grid Views) > Customize Grid.
- Expand the FCSFile node, then the Sample node, and check the boxes for "PTID" and "Well Type".
- Click View Grid.
- Click the header for PTID and select Sort Ascending.
- Click Save above the grid, then Save in the popup to save this grid view as the default.
- Now you can see that the data for each PTID's "Baseline" well is entered into the corresponding BG fields for all other wells for that participant.

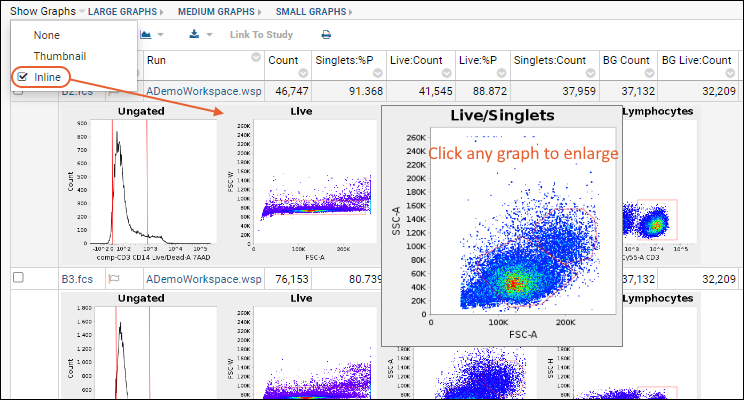
Display graphs by selecting
Show Graphs > Inline as shown here:
Congratulations
You have now completed the tutorial and can use this process with your own data to analyze data against your own defined background.