The enzyme linked immunosorbent assay (ELISA) is a plate-based technique that uses a solid-phase enzyme immunoassay (EIA) to detect the presence of a ligand (commonly a protein) in a liquid sample using antibodies directed against the protein to be measured. The layout of controls, samples, and replicates across a 96-well plate is used to evaluate the meaning of data collected from those wells.
LabKey's ELISA assay type imports and interprets raw data from BioTek Microplate readers.
This tutorial shows you how to:
Set up an ELISA Plate Template and Assay Design
To begin, create an assay folder to work in:
- Log in to your server and navigate to your "Tutorials" project. Create it if necessary.
- If you don't already have a server to work on where you can create projects, start here.
- If you don't know how to create projects and folders, review this topic.
- Create a new subfolder named "ELISA Tutorial". Choose the folder type "Assay".
Next configure a
plate template that corresponds to the plate of your ELISA experiment.
- In the Assay List web part, click Manage Assays.
- Click Configure Plate Templates.
- Select "new 96 well (8X12) ELISA default template" from the dropdown.
- Click Create to open the editor.
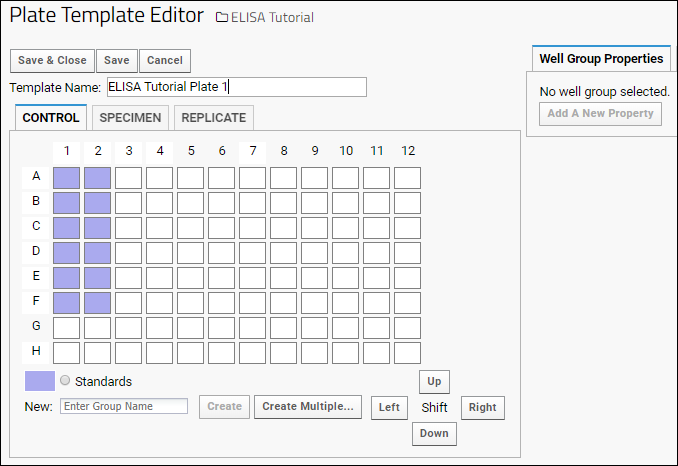
- Enter a Template Name, for example, "ELISA Tutorial Plate 1".
- Review the shape of the template, clicking the Control, Specimen, and Replicate tabs to see the well groupings. Notice that you could edit the template to match alternate well groupings if needed; instructions can be found in Customize Plate Templates. For the purposes of this tutorial, simply save the default.

- When finished, click Save & Close.
Now you can create the
assay design using that template:
- Click the ELISA Tutorial link near the top of the page to return to the main folder page.
- Click New Assay Design.
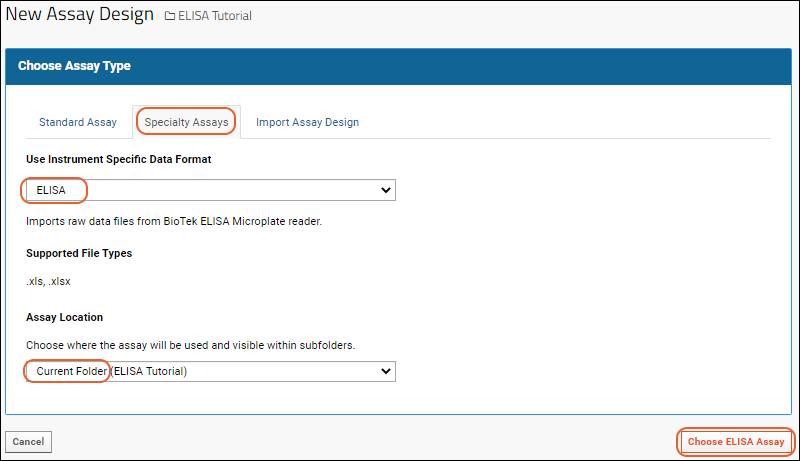
- Click the Specialty Assays tab.
- Select ELISA (if it is not already chosen by default and choose "Current Folder (ELISA Tutorial)" from the Assay Location dropdown, then click Choose ELISA Assay.

- In the Assay Properties section, enter:
- A Name, for example, "ELISA Tutorial Assay".
- Select a Plate Template: "ELISA Tutorial Plate 1" (it may already be selected by default).
- Review the fields defined in each of the other sections by clicking each heading to page through them. You could add or edit fields, but for this tutorial, leave the default design unchanged.
- Click Save.
- You will return to the main folder page and see your new design on the assay list.
Import ELISA Experiment Data
- Download sample data:
- In the ELISA Tutorial folder's Assay List, click the name you gave your assay design, here: ELISA Tutorial Assay.
- Click Import Data.
- For Batch Properties, accept the default settings by clicking Next.
- In the Run Data field, click Choose File (or Browse) and select one of the sample data files you just downloaded. Make no other changes on this page, then click Next.
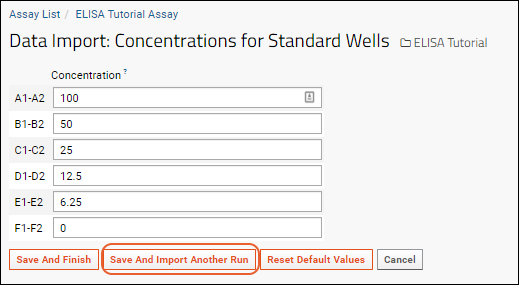
- On the next page, enter Concentrations for Standard Wells as shown here:

- Click Save and Import Another Run.
- Repeat the import process for the other two files, selecting the other two Run Data files in turn. The concentrations for standard wells will retain their values so you do not need to reenter them.
- Click Save and Finish after the last file.
Visualize the Data
When you are finished importing, you'll see the runs grid showing the files you just uploaded. Since you did not specify any other Assay IDs, the filenames are used. Browse the data and available visualizations:
- Hover over the row for Assay Id "biotek_01.xls", then click (details).

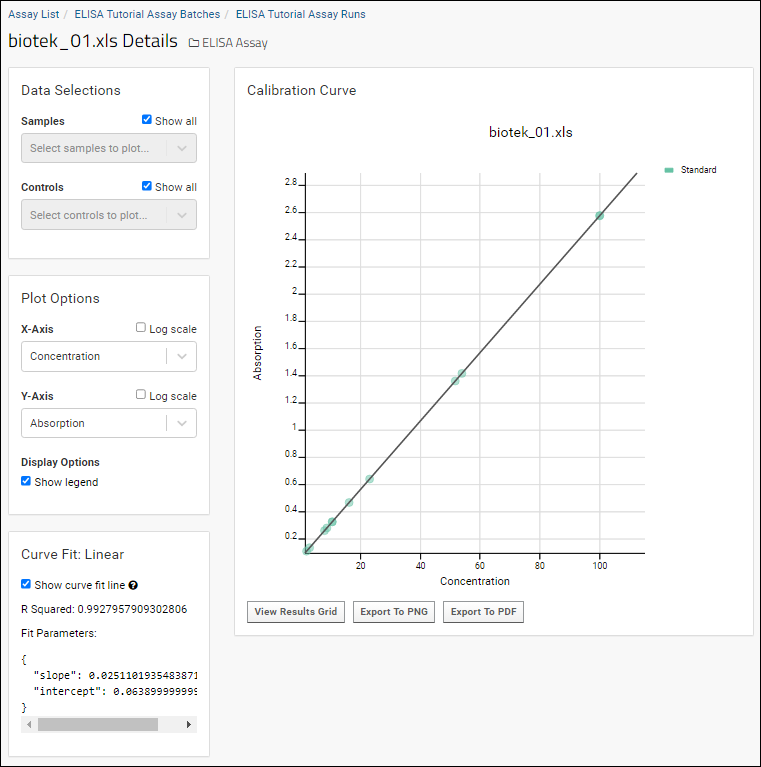
- You will see a visualization of the Calibration Curve.
- Use the Selection options to customize the way you view your data. Learn more about this page in the topic: ELISA Run Details View.

- Below the plot, you can click to View Results Grid, which will show you the results data for the specific run as if you had clicked the AssayId instead of the (details) link.
You have now completed the ELISA tutorial. You can continue to explore the options available on the details page in this topic:
Related Topics