The default dataset grid displays data for all participants. To view data for an individual participant, click on the participantID in the first column of the grid. The
Participant Details View can also be customized to show graphical or other custom views of the data for a single study subject.
Participant Details View
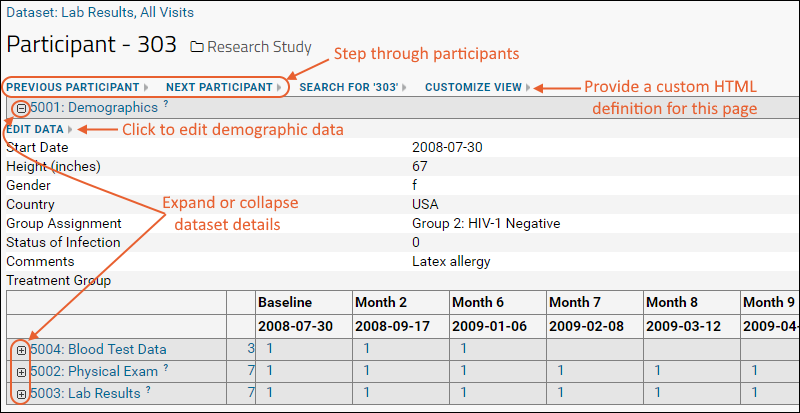
The participant details view lists all of the datasets that contain data for the current participant, as shown in the image below.

- Previous/Next Participant: Page through participants. Note that this option is only provided when you navigate from a dataset listing other participants. Viewing a single participant from the Participants tab does not include these options.
- button: Expand dataset details.
- button: Collapse dataset details
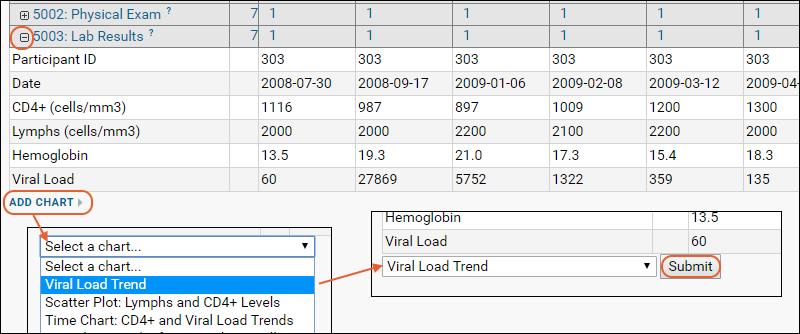
Add Charts
Expand dataset details by clicking the
or name of the dataset of interest. Click
Add Chart to add a visualization to the participant view details. The dropdown will show
the charts defined for this dataset.

After you select a chart from the dropdown, click the
Submit button that will appear.
Once you create a chart for one participant in a participant view, the same chart is displayed for every participant, with that participant's data.

You can add multiple charts per dataset, or different charts for each dataset. To define new charts to use in participant views, use the
plot editor.
Notes:
1. Charts are displayed at a standard size in the default participant details view; custom height and width, if specified in the chart definition, are overridden.
2. Time charts displaying data by participant group
can be included in a participant details view, however the data is filtered to show only data for the individual participant. Disregard the legend showing group names for these trend lines.
Customize Participant Details View
You can alter the HTML used to create the default participant details page and save alternative ways to display the data using the
Customize View link.
- You can make small styling or other adjustments to the "default" script. An example is below
- You can leverage the LabKey APIs to tailor your custom page.
- You can also add the participant.html file via a module. Learn more about file based modules in this webinar: Tech Talk: Custom File-Based Modules

Click
Save to refresh and see the preview below your script. Click
Save and Finish when finished.
Example 1: Align Column of Values
In the standard participant view, the column of values for expanded demographics datasets will be centered over the grid of visits for the clinical datasets. In some cases, this will cause the demographic field values to be outside the visible page. To change where they appear, you can add the following to the standard participant details view (under the closing </script> tag):
<style>
  .labkey-data-region tr td:first-child {width: 300px}
</style>
Use a wider "width" value if you have very long field names in the first column.
Example 2: Tabbed Participant View (Premium Resource)
Another way a developer can customize the participant view is by using HTML with JavaScript to present a tabbed view of participant data. Click the tabs to see the data for a single participant in each category of datasets; step through to see data for other participants.

Premium Resource AvailableSubscribers to premium editions of LabKey Server can use the example code in this topic to create views like the tabbed example above:
Learn more about premium editions
Troubleshooting
If you see field names but no values in the default participant view, particularly for demographic datasets, check to be sure that your field names do not include special characters. If you want to present fields to users with special characters in the names, you can use the "Label" of the field to do so.
Related Topics